
| Tata BSE Quality Index Fund |  |
As on 30th September 2026


|
Type of Scheme: An open ended fund replicating / tracking the BSE Quality Total Return Index (TRI).
Product labelling: • Long Term Capital Appreciation
• Returns that correspond to the total returns of the securities as represented by the BSE Quality Total Return Index, subject to tracking error
Product labelling: • Long Term Capital Appreciation
• Returns that correspond to the total returns of the securities as represented by the BSE Quality Total Return Index, subject to tracking error
Date of Inception / Allotment
Fund Manager Details
Minimum Investment
Load Structure
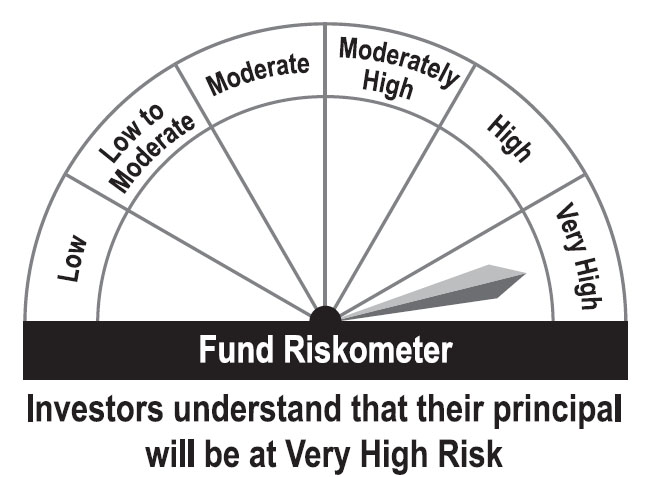
Scheme Riskometer
Tata BSE Quality Index Fund
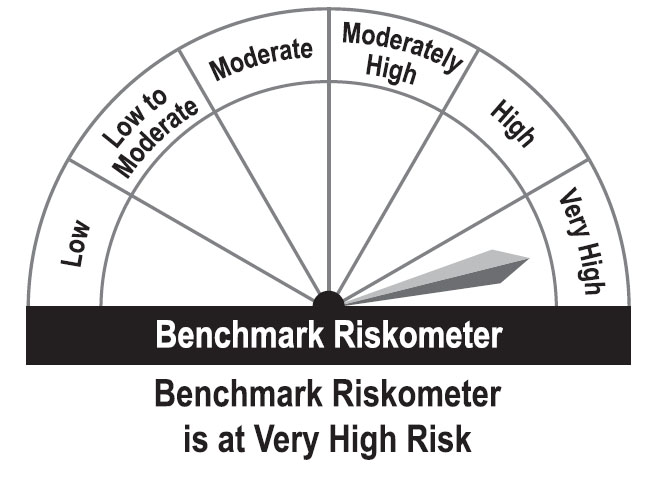
Benchmark Riskometer
BSE Quality Total Return Index (TRI)
03 April 2025
Benchmark NameBSE Quality Total Return Index (TRI)
NAV as on September 30,2026| Regular Plan - Growth Option | : ₹ 10.5909 |
| Regular Plan - IDCW Option | : ₹ 10.5909 |
| Direct Plan - Growth Option | : ₹ 10.7105 |
| Direct Plan - IDCW Option | : ₹ 10.7105 |
| | |
| AUM as on September 30,2026 | : ₹ 46.39 Cr |
| AAUM as on September 30,2026 | : ₹ 54.79 Cr |
Fund Manager Details
Name of Fund Managers
- Mr. Nitin Bharat Sharma
- Mr. Rakesh Indrajeet Prajapati
| Total Experience | : | 19 / 20 |
| Managing Since | : | 01-Jul-2025 / 01-Jul-2025 |
| Lumpsum Amount | : | Rs. 5,000/- and in multiples of Re. 1/- thereafter. |
| SIP | : | Rs. 100/- and in multiples of Re. 1/- thereafter. |
Exit Load: 0.25% of the applicable NAV, if redeemed on or before 15 days from the date of allotment
Base Expense Ratio**| Regular plan : | : 0.90% | ||
| Direct plan : | : 0.30% | ||
| Risk Measures* | ||
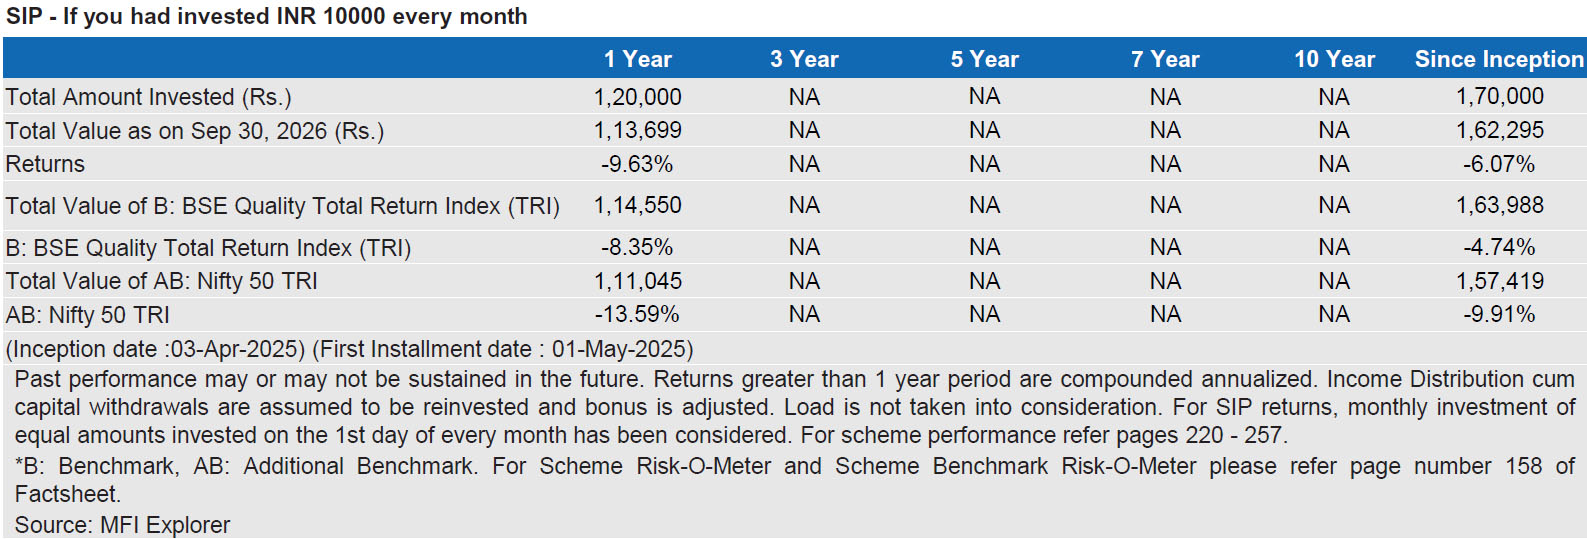
| 1 | Standard Deviation (%) | 17.46 |
| 2 | Beta | 0.94 |
| 3 | Tracking Error (%) | |
| 1 year | 0.82 | |
| 3 years | NA | |
| 4 | Sharpe Ratio (%) | -0.16 |
| 5 | Tracking Difference (%) | |
| 1 year | -1.33 | |
| 3 years | NA | |
| 5 year | NA | |
| Since Inception | -1.44 | |
| 6 | Information Ratio | NA |
|
- Please refer detail description in Description/inference of the Quantitative/Risk Measures
in tabular format
NA stands for “Not Applicable” **Note: The rates specified are actual month end BER charged as on 30th Sep 2026. The above ratio excludes other expenses charged under TER. For more details kindly refer to the TER disclosure on website. https://www.tatamutualfund.com/expense-ratio/ total-expense-ratio | ||
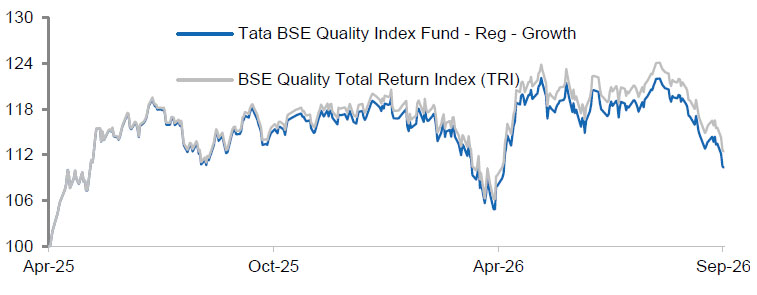
| Compounded Annualised Returns | Scheme Returns % - Regular | Scheme Returns % - Direct | Benchmark Returns % |
| Returns for last 1 year | -2.62 | -1.89 | -1.29 |
| Returns for last 3 years | NA | NA | NA |
| Returns for last 5 years | NA | NA | NA |
| Returns since inception | 3.92 | 4.70 | 5.36 |
Performance as on September 30,2026.
| Top 10 Holdings | % to Net Assets | |
| 1 | ITC Ltd. | 5.29% |
| 2 | Hero Motocorp Ltd. | 5.24% |
| 3 | Multi Commodity Exchange Of India Ltd. | 5.18% |
| 4 | Hindustan Unilever Ltd. | 5.07% |
| 5 | Infosys Ltd. | 5.04% |
| 6 | Dixon Technologies (india) Ltd. | 4.98% |
| 7 | Nestle India Ltd. | 4.94% |
| 8 | Britannia Industries Ltd. | 4.94% |
| 9 | HDFC Asset Management Company Ltd. | 4.93% |
| 10 | Marico Ltd. | 4.90% |
| 1 | Portfolio Turnover Ratio (Annualized) | |
| a) Equity Turnover (%) | 107.95 | |
| b) Gross Exposure Turnover (%) | 107.95 | |
| (Equity + Debt + Derivatives) | ||
| 2 | Average Maturity (years): | NA |
| 3 | Macaulay Duration (years): | NA |
| 4 | Modified Duration (years): | NA |
| 5 | Annualized Portfolio Yield: | NA |
| 6 | Yield to Maturity (%) | NA |
* Please refer detail description in Description/inference of the Quantitative/Risk Measures
in tabular format
NA stands for “Not Applicable”
| 1 | Tracking Error & Tracking Difference Risks | |
| 2 | Regulatory Changes | |
| 3 | Equity Market Risk | |
| 4 | Concentration Risk | |
| 5 | Passive Investments |
*with a detailed explanation in the Important Link Section
Tata BSE Quality Index Fund
Benchmark Riskometer
BSE Quality Total Return Index (TRI)
| Detailed Investment in Securities |  |
| Allocation of Net Asset by Sectors | |
| Allocation of Net Asset by Asset Class | |
| Allocation of Net Assets by Credit Rating | |
| Allocation of Net Assets by region/country | |
Major Changes w.r.t previous month –
| Name of securities added | Name of securities deleted/reduced | Total Weightage in % |
| Cummins India Ltd. | 5.85% | |
| Multi Commodity Exchange of India Ltd. | 5.18% | |
| Suzlon Energy Ltd. | 5.08% | |
| ABB India Ltd. | 4.06% | |
| Siemens Energy India Ltd. | 3.26% | |
| Hindustan Copper Ltd. | 1.82% | |
| Mazagon Dock Shipbuilders Ltd. | 1.68% | |
| Abbott India Ltd. | 1.39% | |
| Premier Energies Ltd. | 1.12% | |
| Procter & Gamble Hygiene & Healthcare Ltd. | 0.75% |
| Change in | Previous Month | Current Month |
| Direct | 0.30% | 0.30% |
| Regular | 0.90% | 0.90% |
| Name of security |
Rating Previous Month |
Rating Current Month |
| NA | NA | NA |
| Fund Name | Previous Month | Current Month |
| Scheme Riskometer | Very High | Very High |
| Sr. No. | Quantitative Measures/Risk Measures | Brief description/ Inference of the Quantitative measure |
| 1 | Standard Deviation | Measures the volatility of the fund |
| 2 | Beta | Shows fund's sensitivity to market movements |
| 3 | Sharpe Ratio | Evaluates the excess return generated per unit of risk |
| 4 | Tracking Error | Indicates how closely fund tracks the Benchmark |
| 5 | Tracking Difference | Difference between the fund and its benchmark return |
| 6 | Portfolio Turnover Ratio | Indicates how actively the portfolio changes |
| 7 | Average Maturity | Weighted average residual maturity |
| 8 | Macaulay Duration | Fund's sensitivity to interest rate changes |
| 9 | Modified Duration | Fund's sensitivity to interest rate changes |
| 10 | Annualized Portfolio Yield | Total income generated by the portfolio |
| 11 | Yield to Maturity | weighted average expected annual return |
| Sr. No. | Links | Description |
| 1 | Video Explainer | Link for a video providing simplified explanation of the Fund Factsheet along with explanation to various terminologies used. |
| 2 | Calculation/Methodology | Link for a pdf showing the various mathematical parameters and their respective Calculation methodology/formulae along with any assumptions considered. |
| 3 | Detailed Risk Factors | Link to be provided for various risk factors associated with the Scheme. |
| 4 |  | Link for SID on AMC website. |
| 5 | Investor Services | Link showing Contact details (Email ID and Telephone Number of the Investor. |
| 6 | Grievance submission and redressal | Link directing to grievance submission page with details showing Escalation matrix. |
Additional Disclosure by AMC
The investment objective of the scheme is to provide returns, before expenses, that commensurate with the performance of BSE Quality Total Return
Index (TRI), subject to tracking error. However, there is no assurance or guarantee that the investment objective of the scheme will be achieved. The
scheme does not assure or guarantee any returns.
| Large Cap | 49.22% |
| Mid Cap | 47.39% |
| Small Cap | 3.39% |
| Market Capitalisation is as per list provided by AMFI. | |
Past Performance is not an indicator or guarantee of future results