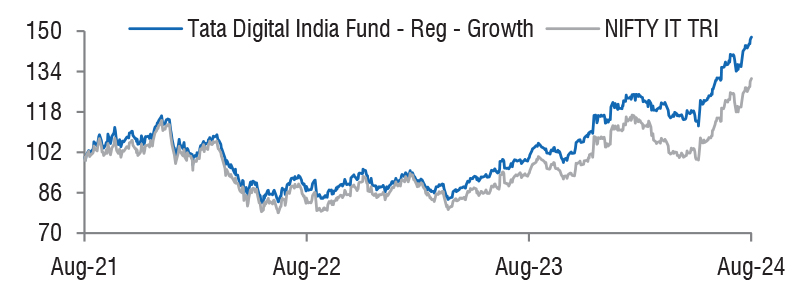
| Tata Digital India Fund
(An open ended equity scheme investing in companies in Information Technology Sector) |
As on 28th February 2025


|
Primarily focuses on investment in at least 80% of its net assets in equity/equity related instruments of the companies in the Information Technology sector in India.
INVESTMENT OBJECTIVE:The investment objective of the scheme is to seek long term capital appreciation by investing atleast 80% of its net assets in equity/equity related instruments of the companies in Information Technology Sector in India.However, there is no assurance or guarantee that the investment objective of the Scheme will be achieved.The Scheme does not assure or guarantee any returns.
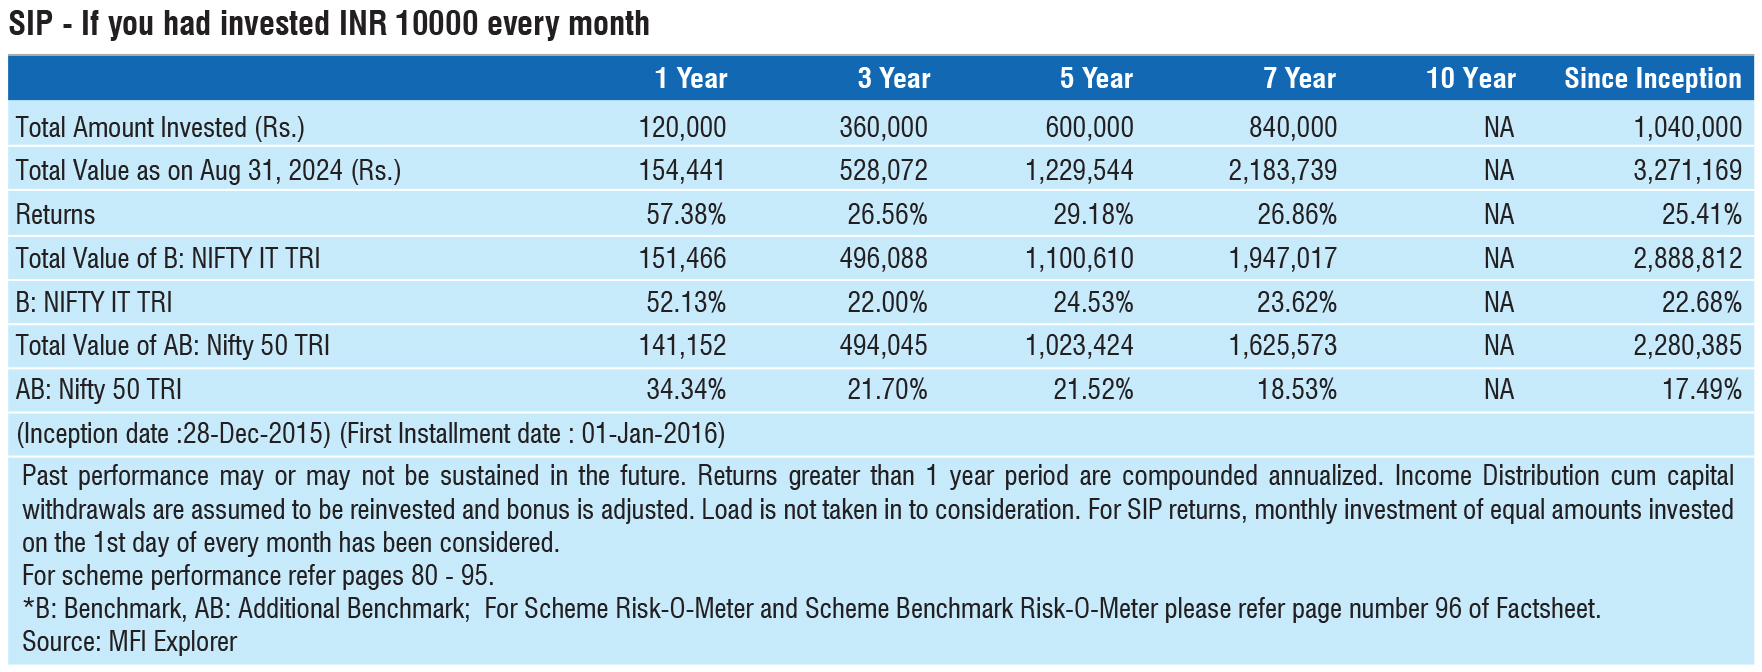
DATE OF ALLOTMENT:December 28, 2015
FUND MANAGER(S)Meeta Shetty (Managing Since 09-Mar-21 and overall experience of 18 years) (Managed in the past from 09-Nov-18 to 08-Mar-2021 as Lead Fund Manager), Kapil Malhotra (Managing Since 19-Dec-23 and overall experience of 15 years)
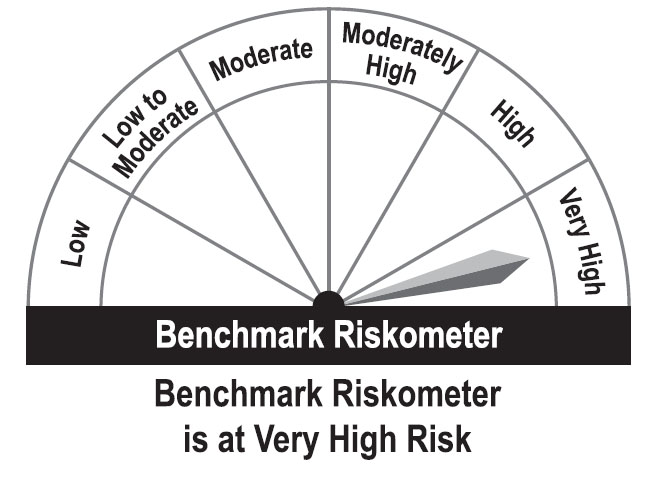
BENCHMARK:NIFTY IT TRI
NAV (in Rs.)| Direct - IDCW | : 52.5623 |
| Direct - Growth | : 52.5623 |
| Regular - IDCW | : 45.3300 |
| Regular - Growth | : 45.3300 |
| FUND SIZE | |
| Rs. 11068.17 (Rs. in Cr.) | |
| MONTHLY AVERAGE AUM | |
| Rs. 12158.04 (Rs. in Cr.) | |
| TURN OVER | |
| Portfolio Turnover (Equity component only) | 13.55% |
| EXPENSE RATIO** | |
| Direct | 0.44 |
| Regular | 1.70 |
| **Note: The rates specified are actual month end expenses charged as on Feb 28, 2025. The above ratio includes the Service tax on Investment Management Fees. The above ratio excludes, borrowing cost, wherever applicable | |
| VOLATILITY MEASURES^ | FUND | BENCHMARK |
| Std. Dev (Annualised) | 19.35 | 21.40 |
| Sharpe Ratio | 0.17 | 0.06 |
| Portfolio Beta | 0.86 | NA |
| R Squared | 0.95 | NA |
| Treynor | 0.33 | NA |
| Jenson | 0.19 | NA |
| ^Risk-free rate based on the FBIL Overnight MIBOR rate of 6.4% as
on Feb 28, 2025 For calculation methodology | ||
MULTIPLES FOR NEW INVESTMENT:
Rs. 5,000/- and in multiples of Re. 1/- thereafter.
ADDITIONAL INVESTMENT/MULTIPLES FOR EXISTING INVESTORS:
Rs. 1,000/- and multiples of Re. 1/- thereafter.
LOAD STRUCTURE:| ENTRY LOAD | Not Applicable |
| EXIT LOAD | 0.25% of NAV if redeemed/switched out before 30
days from the date of allotment. |
Please refer to our Tata Mutual Fund website for fundamental changes, wherever applicable
| Company name | No. of Shares | Market Value Rs Lakhs | % of Assets |
| Equity & Equity Related Total | 1059161.73 | 95.68 | |
| Capital Markets | |||
| Bse Ltd. | 405389 | 18784.51 | 1.70 |
| Commercial Services & Supplies | |||
| Firstsource Solutions Ltd. | 10123112 | 35025.97 | 3.16 |
| Eclerx Services Ltd. | 241318 | 6838.71 | 0.62 |
| Redington (India) Ltd. | 1383040 | 3102.44 | 0.28 |
| Electrical Equipment | |||
| Abb India Ltd. | 205572 | 10145.80 | 0.92 |
| Siemens Ltd. | 205694 | 9510.26 | 0.86 |
| Financial Technology (Fintech) | |||
| Pb Fintech Ltd. | 1399524 | 20483.43 | 1.85 |
| It - Services | |||
| Cyient Ltd. | 1855043 | 23506.18 | 2.12 |
| Affle (India) Ltd. | 389317 | 5451.41 | 0.49 |
| L&T Technology Services Ltd. | 105154 | 4766.84 | 0.43 |
| Netweb Technologies India Ltd. | 268803 | 3908.13 | 0.35 |
| It - Software | |||
| Infosys Ltd. | 12430857 | 209795.57 | 18.95 |
| Tata Consultancy Services Ltd. | 3976873 | 138524.43 | 12.52 |
| Tech Mahindra Ltd. | 7145933 | 106320.76 | 9.61 |
| Wipro Ltd. | 32787324 | 91034.01 | 8.22 |
| HCL Technologies Ltd. | 4983886 | 78498.70 | 7.09 |
| Ltimindtree Ltd. | 988062 | 46102.48 | 4.17 |
| Persistent Systems Ltd. | 759192 | 40266.78 | 3.64 |
| Sonata Software Ltd. | 5225514 | 18864.11 | 1.70 |
| Newgen Software Technologies Ltd. | 1541202 | 14429.50 | 1.30 |
| Birlasoft Ltd. | 2543638 | 10786.30 | 0.97 |
| Mastek Ltd. | 472816 | 10523.70 | 0.95 |
| Zensar Technologies Ltd. | 1291078 | 9533.97 | 0.86 |
| Rategain Travel Technologies Ltd. | 992598 | 4863.73 | 0.44 |
| Kpit Technologies Ltd. | 331400 | 3968.18 | 0.36 |
| Mphasis Ltd. | 153730 | 3454.70 | 0.31 |
| Latent View Analytics Ltd. | 438435 | 1680.30 | 0.15 |
| Quick Heal Technologies Ltd. | 425000 | 1258.64 | 0.11 |
| Industrial Manufacturing | |||
| Honeywell Automation India Ltd. | 10280 | 3464.53 | 0.31 |
| Leisure Services | |||
| Le Travenues Technology Ltd. | 2688172 | 3598.92 | 0.33 |
| Tbo Tek Ltd. | 217392 | 2610.55 | 0.24 |
| Yatra Online Ltd. | 2000000 | 1404.00 | 0.13 |
| Retailing | |||
| Zomato Ltd. | 29067000 | 64557.81 | 5.83 |
| Info Edge (India) Ltd. | 169830 | 11875.62 | 1.07 |
| Swiggy Ltd. | 1509930 | 5052.98 | 0.46 |
| Cartrade Tech Ltd. | 180070 | 2752.46 | 0.25 |
| Telecom - Services | |||
| Bharti Airtel Ltd. | 1469200 | 23069.38 | 2.08 |
| Tata Communications Ltd. | 561700 | 7596.99 | 0.69 |
| Transport Services | |||
| Delhivery Ltd. | 700000 | 1748.95 | 0.16 |
| Repo | 38495.18 | 3.48 | |
| Portfolio Total | 1097656.91 | 99.16 | |
| Cash / Net Current Asset | 9160.04 | 0.84 | |
| Net Assets | 1106816.95 | 100.00 | |
| Issuer Name | % to NAV |
| Infosys Ltd. | 18.95 |
| Tata Consultancy Services Ltd. | 12.52 |
| Tech Mahindra Ltd. | 9.61 |
| Wipro Ltd. | 8.22 |
| HCL Technologies Ltd. | 7.09 |
| Zomato Ltd. | 5.83 |
| Ltimindtree Ltd. | 4.17 |
| Persistent Systems Ltd. | 3.64 |
| Firstsource Solutions Ltd. | 3.16 |
| Cyient Ltd. | 2.12 |
| Total | 75.31 |
| Large Cap | 75.01% |
| Mid Cap | 9.70% |
| Small Cap | 15.28% |
| Market Capitalisation is as per list provided by AMFI. | |