| Tata Dividend Yield Fund
(An open ended equity scheme that aims for growth by primarily investing in equity and equity related instruments of dividend yielding companies.) |
As on 28th February 2025


|
Predominantly investing in a well-diversified portfolio of equity and equity related instruments of dividend yielding companies.
INVESTMENT OBJECTIVE:The investment objective is to provide capital appreciation and/or dividend distribution by predominantly investing in a well-diversified portfolio of equity and equity related instruments of dividend yielding companies. However, there is no assurance or guarantee that the investment objective of the Scheme will be achieved. The scheme does not assure or guarantee any returns.
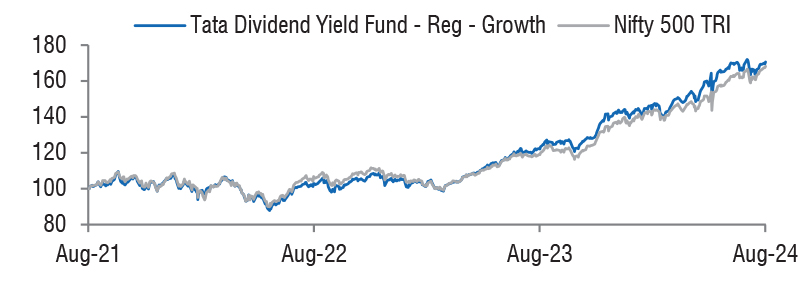
DATE OF ALLOTMENT:May 20,2021
FUND MANAGER(S)Sailesh Jain (Lead Fund Manager) (Managing Since 20-May-21 and overall experience of 21 years), Murthy Nagarajan (Debt Porrtfolio) (Managing Since 20-May-21 and overall experience of 27 years), Kapil Malhotra (Managing Since 19-Dec-23 and overall experience of 14 years)
BENCHMARK:Nifty 500 TRI
NAV (in Rs.)| Direct - Growth | : 16.1340 |
| Direct - IDCW | : 16.1340 |
| Reg - Growth | : 15.0876 |
| Reg - IDCW | : 15.0876 |
| FUND SIZE | |
| Rs. 839.00 (Rs. in Cr.) | |
| MONTHLY AVERAGE AUM | |
| Rs. 883.85 (Rs. in Cr.) | |
| TURN OVER | |
| Portfolio Turnover (Equity component only) | 25.51% |
| EXPENSE RATIO** | |
| Direct | 0.78 |
| Regular | 2.28 |
| **Note: The rates specified are actual month end expenses charged
as on Feb 28, 2025. The above ratio includes the Service tax on
Investment Management Fees. The above ratio excludes, borrowing
cost, wherever applicable. For calculation methodology | |
| VOLATILITY MEASURES^ | FUND | BENCHMARK |
| Std. Dev (Annualised) | 15.14 | 13.81 |
| Sharpe Ratio | 0.39 | 0.56 |
| Portfolio Beta | 0.98 | NA |
| R Squared | 0.93 | NA |
| Treynor | 0.51 | NA |
| Jenson | -0.05 | NA |
| ^Risk-free rate based on the FBIL Overnight MIBOR rate
of 6.4% as on Feb 28, 2025 For calculation methodology | ||
MULTIPLES FOR NEW INVESTMENT:
Rs. 5,000/- and in multiples of Re. 1/- thereafter.
ADDITIONAL INVESTMENT/MULTIPLES FOR EXISTING INVESTORS:
Rs. 1,000/- and multiples of Re. 1/- thereafter.
LOAD STRUCTURE:| ENTRY LOAD | Not Applicable |
| EXIT LOAD |
Redemption/Switch-out/SWP/STP on or before expiry of 365 days
from the date of allotment: If the withdrawal amount or switched out
amount is not more than 12% of the original cost of investment - NIL Redemption/Switch-out/SWP/STP on or before expiry of 365 days from the date of allotment: If the withdrawal amount or switched out amount is more than 12%of the original cost of investment-1% Redemption/Switch-out/SWP/STP after expiry of 365 days from the date of allotment - NIL |
Please refer to our Tata Mutual Fund website for fundamental changes, wherever applicable
| Company Name | No. of Shares | Market Value Rs Lakhs | % of assets |
| Equity & Equity Related Total | 81275.43 | 96.88 | |
| Aerospace And Defense | |||
| Bharat Electronics Ltd. | 1527000 | 3760.24 | 4.48 |
| Hindustan Aeronautics Ltd. | 34000 | 1049.99 | 1.25 |
| Auto Components | |||
| Uno Minda Ltd. | 127100 | 1049.72 | 1.25 |
| Sundram Fasteners Ltd. | 80625 | 752.96 | 0.90 |
| Automobiles | |||
| Tvs Motor Company Ltd. | 29400 | 654.30 | 0.78 |
| Banks | |||
| HDFC Bank Ltd. | 217748 | 3772.27 | 4.50 |
| ICICI Bank Ltd. | 286930 | 3454.92 | 4.12 |
| State Bank Of India | 237025 | 1632.63 | 1.95 |
| Indusind Bank Ltd. | 142078 | 1406.71 | 1.68 |
| Au Small Finance Bank Ltd. | 224252 | 1268.59 | 1.51 |
| Indian Bank | 226200 | 1155.43 | 1.38 |
| Rbl Bank Ltd. | 731665 | 1158.52 | 1.38 |
| Bank Of India | 1122000 | 1067.70 | 1.27 |
| Axis Bank Ltd. | 103400 | 1050.08 | 1.25 |
| IDFC First Bank Ltd. | 1150000 | 671.49 | 0.80 |
| Beverages | |||
| Radico Khaitan Ltd. | 88690 | 1838.59 | 2.19 |
| Capital Markets | |||
| HDFC Asset Management Company Ltd. | 41601 | 1509.41 | 1.80 |
| Angel One Ltd. | 44677 | 969.11 | 1.16 |
| Cement & Cement Products | |||
| ACC Ltd. | 68816 | 1251.45 | 1.49 |
| Chemicals & Petrochemicals | |||
| Navin Fluorine International Ltd. | 38524 | 1449.37 | 1.73 |
| Vinati Organics Ltd. | 53900 | 821.84 | 0.98 |
| Construction | |||
| Larsen & Toubro Ltd. | 76389 | 2416.83 | 2.88 |
| Knr Constructions Ltd. | 332333 | 732.46 | 0.87 |
| Ceigall India Ltd. | 186190 | 480.00 | 0.57 |
| Consumable Fuels | |||
| Coal India Ltd. | 250000 | 923.38 | 1.10 |
| Consumer Durables | |||
| Voltas Ltd. | 89000 | 1174.89 | 1.40 |
| Cello World Ltd. | 68908 | 381.68 | 0.45 |
| Diversified Fmcg | |||
| ITC Ltd. | 354281 | 1399.41 | 1.67 |
| Hindustan Unilever Ltd. | 62539 | 1369.76 | 1.63 |
| Electrical Equipment | |||
| Thermax Ltd. | 37180 | 1207.79 | 1.44 |
| Abb India Ltd. | 14764 | 728.66 | 0.87 |
| Voltamp Transformers Ltd. | 9592 | 602.19 | 0.72 |
| Fertilizers & Agrochemicals | |||
| Pi Industries Ltd. | 25710 | 774.89 | 0.92 |
| Finance | |||
| Pnb Housing Finance Ltd. | 262933 | 2007.10 | 2.39 |
| Muthoot Finance Ltd. | 58000 | 1237.02 | 1.47 |
| Shriram Finance Ltd. | 196770 | 1214.66 | 1.45 |
| Creditaccess Grameen Ltd. | 108000 | 992.63 | 1.18 |
| Bajaj Finance Ltd. | 9100 | 776.26 | 0.93 |
| Rec Ltd. | 189000 | 680.97 | 0.81 |
| Food Products | |||
| Nestle India Ltd. | 37700 | 825.50 | 0.98 |
| Gas | |||
| Petronet Lng Ltd. | 314000 | 889.56 | 1.06 |
| Gail ( India ) Ltd. | 488000 | 761.48 | 0.91 |
| It - Software | |||
| Infosys Ltd. | 127400 | 2150.13 | 2.56 |
| Tata Consultancy Services Ltd. | 61081 | 2127.60 | 2.54 |
| Persistent Systems Ltd. | 25410 | 1347.72 | 1.61 |
| Kpit Technologies Ltd. | 64000 | 766.34 | 0.91 |
| Industrial Manufacturing | |||
| Titagarh Rail Systems Ltd. | 138690 | 966.67 | 1.15 |
| Syrma Sgs Technology Ltd. | 208100 | 861.22 | 1.03 |
| Industrial Products | |||
| Polycab India Ltd. | 36499 | 1720.34 | 2.05 |
| Apl Apollo Tubes Ltd. | 65081 | 936.48 | 1.12 |
| Insurance | |||
| ICICI Lombard General Insurance Co. Ltd. | 39800 | 673.00 | 0.80 |
| Minerals & Mining | |||
| Gravita India Ltd. | 47705 | 760.75 | 0.91 |
| Non - Ferrous Metals | |||
| Hindalco Industries Ltd. | 254592 | 1615.00 | 1.92 |
| Petroleum Products | |||
| Reliance Industries Ltd. | 144000 | 1728.14 | 2.06 |
| Pharmaceuticals & Biotechnology | |||
| Eris Lifesciences Ltd. | 55796 | 659.96 | 0.79 |
| Power | |||
| Power Grid Corporation Of India Ltd. | 789969 | 1981.64 | 2.36 |
| NTPC Ltd. | 530200 | 1651.31 | 1.97 |
| Nhpc Ltd. | 1506215 | 1098.03 | 1.31 |
| Adani Power Ltd. | 172200 | 824.75 | 0.98 |
| Tata Power Company Ltd. | 236979 | 803.83 | 0.96 |
| Adani Energy Solutions Ltd. | 92213 | 600.21 | 0.72 |
| Realty | |||
| Sobha Ltd. | 65959 | 791.90 | 0.94 |
| Retailing | |||
| Zomato Ltd. | 705000 | 1565.81 | 1.87 |
| Transport Infrastructure | |||
| Adani Ports And Special Economic Zone Ltd. | 97350 | 1041.06 | 1.24 |
| Transport Services | |||
| Spicejet Ltd. | 1623376 | 745.29 | 0.89 |
| Ecos India Mobility And Hospitality Ltd. | 299420 | 535.81 | 0.64 |
| Name of the Instrument | Units | Market Value Rs. Lakhs | % to NAV |
| Mutual Fund Units Related | |||
| Mutual Fund Units | |||
| Tata Money Market Fund | 7311.774 | 341.78 | 0.41 |
| Mutual Fund Units Total | 341.78 | 0.41 | |
| Repo | 1803.31 | 2.15 | |
| Portfolio Total | 83420.52 | 99.44 | |
| Cash / Net Current Asset | 479.45 | 0.56 | |
| Net Assets | 83899.97 | 100.00 | |
| Issuer Name | % to NAV |
| HDFC Bank Ltd. | 4.50 |
| Bharat Electronics Ltd. | 4.48 |
| ICICI Bank Ltd. | 4.12 |
| Larsen & Toubro Ltd. | 2.88 |
| Infosys Ltd. | 2.56 |
| Tata Consultancy Services Ltd. | 2.54 |
| Pnb Housing Finance Ltd. | 2.39 |
| Power Grid Corporation Of India Ltd. | 2.36 |
| Radico Khaitan Ltd. | 2.19 |
| Reliance Industries Ltd. | 2.06 |
| Total | 30.08 |
| Large Cap | 54.48% |
| Mid Cap | 23.98% |
| Small Cap | 21.54% |
| Market Capitalisation is as per list provided by AMFI. | |