| Tata ELSS Tax Saver Fund
(An open ended equity linked savings scheme with a statutory lock in of 3 years and tax benefit) |
 |
As on 28th February 2025


|
An equity linked tax savings scheme (ELSS) that aims to provide medium to long term capital gains along with income tax benefit under Section 80C of the Income Tax Act.
INVESTMENT OBJECTIVE:To provide medium to long term capital gains along with income tax relief to its Unitholders, while at all times emphasising the importance of capital appreciation. However, there is no assurance or guarantee that the investment objective of the Scheme will be achieved. The scheme does not assure or guarantee any returns.
DATE OF ALLOTMENT:March 31,1996
FUND MANAGER(S)Tejas Gutka (Managing Since 09-Mar-21 and overall experience of 18 years)
ASSISTANT FUND MANAGER:Sailesh Jain (Managing Since 16-Dec-21 and overall experience of 22 years)
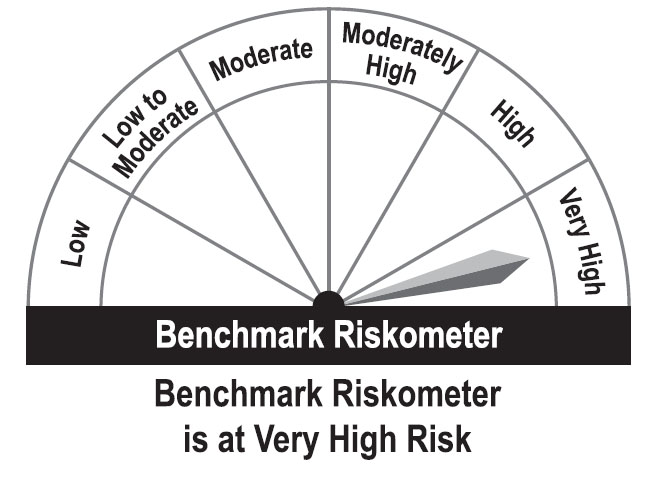
BENCHMARK:Nifty 500 TRI
NAV (in Rs.)| Direct- IDCW | : 199.5561 |
| Reg - IDCW | : 89.2018 |
| Direct- Growth | : 43.6528 |
| Reg- Growth | : 38.3003 |
| FUND SIZE | |
| Rs. 4053.35 (Rs. in Cr.) | |
| MONTHLY AVERAGE AUM | |
| Rs. 4274.12 (Rs. in Cr.) | |
| TURN OVER | |
| Portfolio Turnover (Equity component only) | 15.00% |
| EXPENSE RATIO** | |
| Direct | 0.74 |
| Regular | 1.85 |
| **Note: The rates specified are actual month end expenses charged as on Feb 28, 2025. The above ratio includes the GST on Investment Management Fees. The above ratio excludes, borrowing cost, wherever applicable. | |
| VOLATILITY MEASURES^ | FUND | BENCHMARK |
| Std. Dev (Annualised) | 14.54 | 14.47 |
| Sharpe Ratio | 0.41 | 0.46 |
| Portfolio Beta | 0.95 | NA |
| R Squared | 0.94 | NA |
| Treynor | 0.54 | NA |
| Jenson | -0.02 | NA |
| ^Risk-free rate based on the FBIL Overnight MIBOR rate of 6.4% as on Feb 28, 2025 For calculation methodology | ||
MULTIPLES FOR NEW INVESTMENT:
Rs. 500/- and in multiples of Rs. 500/- thereafter.
ADDITIONAL INVESTMENT/MULTIPLES FOR EXISTING INVESTORS:
Rs. 500/- and multiples of Rs. 500/- thereafter.
LOAD STRUCTURE:| ENTRY LOAD | Not Applicable |
| EXIT LOAD |
Nil (Compulsory lock-in period for 3
years)
|
Please refer to our Tata Mutual Fund website for fundamental changes, wherever applicable
| Company Name | No. of Shares | Market Value Rs Lakhs | % of assets |
| Equity & Equity Related Total | 385844.38 | 95.21 | |
| Aerospace And Defense | |||
| Bharat Electronics Ltd. | 1425000 | 3509.06 | 0.87 |
| Auto Components | |||
| Samvardhana Motherson International Ltd. | 6800000 | 8064.12 | 1.99 |
| Pricol Ltd. | 1970465 | 7839.50 | 1.93 |
| Shriram Pistons & Rings Ltd. | 220000 | 4065.05 | 1.00 |
| Craftsman Automation Ltd. | 83500 | 3759.04 | 0.93 |
| Uno Minda Ltd. | 440714 | 3639.86 | 0.90 |
| Varroc Engineering Ltd. | 740000 | 3121.69 | 0.77 |
| Automobiles | |||
| Tata Motors Ltd. | 765000 | 4747.97 | 1.17 |
| Banks | |||
| HDFC Bank Ltd. | 1725000 | 29883.90 | 7.37 |
| ICICI Bank Ltd. | 2125000 | 25587.13 | 6.31 |
| State Bank Of India | 2175000 | 14981.40 | 3.70 |
| Axis Bank Ltd. | 1300000 | 13202.15 | 3.26 |
| Federal Bank Ltd. | 3600000 | 6394.32 | 1.58 |
| City Union Bank Ltd. | 2500000 | 3695.00 | 0.91 |
| Beverages | |||
| Radico Khaitan Ltd. | 288753 | 5985.99 | 1.48 |
| Capital Markets | |||
| Uti Asset Management Company Ltd. | 505000 | 4751.55 | 1.17 |
| Cement & Cement Products | |||
| Ultratech Cement Ltd. | 70000 | 7089.92 | 1.75 |
| Ambuja Cements Ltd. | 1000000 | 4649.50 | 1.15 |
| Construction | |||
| Larsen & Toubro Ltd. | 352147 | 11141.40 | 2.75 |
| H.G. Infra Engineering Ltd. | 291520 | 2811.42 | 0.69 |
| Knr Constructions Ltd. | 1000000 | 2204.00 | 0.54 |
| Consumable Fuels | |||
| Coal India Ltd. | 1450000 | 5355.58 | 1.32 |
| Consumer Durables | |||
| Voltas Ltd. | 400000 | 5280.40 | 1.30 |
| P N Gadgil Jewellers Ltd. | 145084 | 780.48 | 0.19 |
| Electrical Equipment | |||
| Transrail Lighting Ltd. | 803831 | 4156.61 | 1.03 |
| Fertilizers & Agrochemicals | |||
| Pi Industries Ltd. | 150000 | 4520.93 | 1.12 |
| Finance | |||
| Bajaj Finance Ltd. | 107000 | 9127.42 | 2.25 |
| Sbi Cards And Payment Services Ltd. | 787598 | 6606.37 | 1.63 |
| Power Finance Corporation Ltd. | 1275000 | 4644.83 | 1.15 |
| Rec Ltd. | 1155000 | 4161.47 | 1.03 |
| Gas | |||
| Gujarat State Petronet Ltd. | 20 | 0.05 | 0.00 |
| Healthcare Equipment & Supplies | |||
| Laxmi Dental Ltd. | 280401 | 951.26 | 0.23 |
| Household Products | |||
| Flair Writing Industries Ltd. | 1732793 | 3709.91 | 0.92 |
| It - Software | |||
| Infosys Ltd. | 1160000 | 19577.32 | 4.83 |
| HCL Technologies Ltd. | 510000 | 8032.76 | 1.98 |
| Tech Mahindra Ltd. | 260000 | 3868.41 | 0.95 |
| Industrial Products | |||
| Cummins India Ltd. | 230000 | 6251.29 | 1.54 |
| Kei Industries Ltd. | 144998 | 4451.66 | 1.10 |
| Graphite India Ltd. | 1000000 | 3914.50 | 0.97 |
| Kirloskar Pneumatic Company Ltd. | 343014 | 3428.25 | 0.85 |
| Insurance | |||
| ICICI Lombard General Insurance Co. Ltd. | 375000 | 6341.06 | 1.56 |
| Sbi Life Insurance Company Ltd. | 300000 | 4291.50 | 1.06 |
| Leisure Services | |||
| Jubilant Foodworks Ltd. | 725000 | 4539.23 | 1.12 |
| Restaurant Brands Asia Ltd. | 5983000 | 3815.96 | 0.94 |
| Barbeque Nation Hospitality Ltd. | 700000 | 1945.65 | 0.48 |
| Minerals & Mining | |||
| Gravita India Ltd. | 391273 | 6239.63 | 1.54 |
| Non - Ferrous Metals | |||
| Hindalco Industries Ltd. | 900000 | 5709.15 | 1.41 |
| Petroleum Products | |||
| Reliance Industries Ltd. | 1350000 | 16201.35 | 4.00 |
| Pharmaceuticals & Biotechnology | |||
| Sun Pharmaceutical Industries Ltd. | 475000 | 7567.94 | 1.87 |
| Ami Organics Ltd. | 324173 | 7030.18 | 1.73 |
| Cipla Ltd. | 400000 | 5630.00 | 1.39 |
| Power | |||
| NTPC Ltd. | 3451000 | 10748.14 | 2.65 |
| Realty | |||
| Brigade Enterprises Ltd. | 526000 | 4981.48 | 1.23 |
| Anant Raj Ltd. | 1013513 | 4695.10 | 1.16 |
| Retailing | |||
| V-Mart Retail Ltd. | 256867 | 7683.28 | 1.90 |
| Telecom - Services | |||
| Bharti Airtel Ltd. | 940000 | 14759.88 | 3.64 |
| Bharti Airtel Ltd. (Right 14/10/2021) (Partly Paid) | 96428 | 1075.94 | 0.27 |
| Textiles & Apparels | |||
| Pearl Global Industries Ltd. | 197119 | 2645.44 | 0.65 |
| Repo | 9809.44 | 2.42 | |
| Portfolio Total | 395653.82 | 97.63 | |
| Cash / Net Current Asset | 9680.74 | 2.37 | |
| Net Assets | 405334.56 | 100.00 | |
| Issuer Name | % to NAV |
| HDFC Bank Ltd. | 7.37 |
| ICICI Bank Ltd. | 6.31 |
| Infosys Ltd. | 4.83 |
| Reliance Industries Ltd. | 4.00 |
| Bharti Airtel Ltd. | 3.91 |
| State Bank Of India | 3.70 |
| Axis Bank Ltd. | 3.26 |
| Larsen & Toubro Ltd. | 2.75 |
| NTPC Ltd. | 2.65 |
| Bajaj Finance Ltd. | 2.25 |
| Total | 41.03 |
| Large Cap | 64.76% |
| Mid Cap | 10.83% |
| Small Cap | 24.42% |
| Market Capitalisation is as per list provided by AMFI. | |
