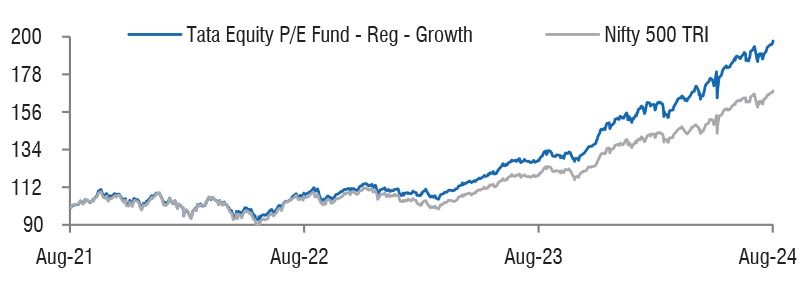
| Tata Equity P/E Fund
(An open ended equity scheme following a value investment strategy) |
As on 28th February 2025


|
Primarily invests at least 70% of the net assets in equity shares whose rolling P/E ratio on past four quarter earnings for individual companies is less than rolling P/E of the BSE SENSEX stocks.
INVESTMENT OBJECTIVE:The investment objective of the Scheme is to provide reasonable and regular income and/or possible capital appreciation to its Unitholder. However, there is no assurance or guarantee that the investment objective of the Scheme will be achieved. The scheme does not assure or guarantee any returns.
DATE OF ALLOTMENT:June 29, 2004
FUND MANAGER(S)Sonam Udasi (Managing Since 01-Apr-16 and overall experience of 27 years), Amey Sathe (Managing Since 01-Jul-23 and overall experience of 17 years) (Managed in the past as Assistant Fund Manager from 18-Jun-2018 till 30-Jun-2023)
BENCHMARK:Nifty 500 TRI
NAV (in Rs.)| Direct - Growth | : 338.3615 |
| Direct - IDCW (Trigger Option A 5%) | : 124.3290 |
| Direct - IDCW (Trigger Option B 10%) | : 114.9893 |
| Reg - Growth | : 301.6053 |
| Reg - IDCW (Trigger Option A 5%) | : 112.1911 |
| Reg - IDCW (Trigger Option B 10%) | : 100.9551 |
| FUND SIZE | |
| Rs. 7468.42 (Rs. in Cr.) | |
| MONTHLY AVERAGE AUM | |
| Rs. 7829.93 (Rs. in Cr.) | |
| TURN OVER | |
| Portfolio Turnover (Equity component only) | 72.94% |
| EXPENSE RATIO** | |
| Direct | 0.84 |
| Regular | 1.82 |
| **Note: The rates specified are actual month end expenses charged as on Feb 28, 2025. The above ratio includes the GST on Investment Management Fees. The above ratio excludes, borrowing cost, wherever applicable. | |
| VOLATILITY MEASURES^ | FUND | BENCHMARK |
| Std. Dev (Annualised) | 14.75 | 14.47 |
| Sharpe Ratio | 0.72 | 0.46 |
| Portfolio Beta | 0.96 | NA |
| R Squared | 0.93 | NA |
| Treynor | 0.93 | NA |
| Jenson | 0.36 | NA |
| PE | 24.88 | 20.38 |
| ^Risk-free rate based on the FBIL Overnight MIBOR rate of 6.4% as
on Feb 28, 2025 For calculation methodology | ||
MULTIPLES FOR NEW INVESTMENT:
Rs. 5,000/- and in multiples of Re. 1/- thereafter.
ADDITIONAL INVESTMENT/MULTIPLES FOR EXISTING INVESTORS:
Rs. 1,000/- and multiples of Re. 1/- thereafter.
LOAD STRUCTURE:| ENTRY LOAD | Not Applicable |
| EXIT LOAD |
1) On or before expiry of 12 months from
the date of allotment: If the withdrawal
amount or switched out amount is not
more than 12% of the original cost of
investment: NIL 2) On or before expiry of 12 months from the date of allotment: If the withdrawal amount or switched out amount is more than 12% of the original cost of investment: 1% 3) Redemption after expiry of 12 months from the date of allotment: NIL (w.e.f. 3rd May, 2019) |
Please refer to our Tata Mutual Fund website for fundamental changes, wherever applicable
| Company Name | No. of Shares | Market Value Rs Lakhs | % of assets |
| Equity & Equity Related Total | 674272.82 | 90.31 | |
| Auto Components | |||
| Ceat Ltd. | 401266 | 10162.06 | 1.36 |
| Automobiles | |||
| Bajaj Auto Ltd. | 147664 | 11669.74 | 1.56 |
| Hero Motocorp Ltd. | 308000 | 11337.79 | 1.52 |
| Banks | |||
| HDFC Bank Ltd. | 4473000 | 77490.25 | 10.38 |
| ICICI Bank Ltd. | 1720000 | 20710.52 | 2.77 |
| Kotak Mahindra Bank Ltd. | 900000 | 17126.55 | 2.29 |
| Federal Bank Ltd. | 8000000 | 14209.60 | 1.90 |
| Beverages | |||
| Radico Khaitan Ltd. | 1257971 | 26078.37 | 3.49 |
| Capital Markets | |||
| Motilal Oswal Financial Service Ltd. | 3357000 | 19755.95 | 2.65 |
| Uti Asset Management Company Ltd. | 2053547 | 19321.82 | 2.59 |
| Angel One Ltd. | 531000 | 11518.19 | 1.54 |
| Cement & Cement Products | |||
| ACC Ltd. | 515940 | 9382.63 | 1.26 |
| Construction | |||
| G R Infraprojects Ltd. | 285260 | 2867.86 | 0.38 |
| Consumable Fuels | |||
| Coal India Ltd. | 8820000 | 32576.67 | 4.36 |
| Consumer Durables | |||
| Greenpanel Industries Ltd. | 4517029 | 12148.55 | 1.63 |
| Diversified Fmcg | |||
| ITC Ltd. | 6310000 | 24924.50 | 3.34 |
| Entertainment | |||
| Sun Tv Network Ltd. | 1945000 | 10921.18 | 1.46 |
| Finance | |||
| Muthoot Finance Ltd. | 1323000 | 28216.94 | 3.78 |
| Shriram Finance Ltd. | 4230000 | 26111.79 | 3.50 |
| Pnb Housing Finance Ltd. | 2238166 | 17085.04 | 2.29 |
| Power Finance Corporation Ltd. | 4473000 | 16295.14 | 2.18 |
| Gas | |||
| Indraprastha Gas Ltd. | 3618000 | 6855.39 | 0.92 |
| It - Software | |||
| Wipro Ltd. | 10980000 | 30485.97 | 4.08 |
| Tata Consultancy Services Ltd. | 486000 | 16928.60 | 2.27 |
| Sonata Software Ltd. | 1485000 | 5360.85 | 0.72 |
| Industrial Products | |||
| Time Technoplast Ltd. | 1500000 | 5361.75 | 0.72 |
| Leisure Services | |||
| Restaurant Brands Asia Ltd. | 7936857 | 5062.13 | 0.68 |
| Minerals & Mining | |||
| NMDC Ltd. | 12645273 | 7900.77 | 1.06 |
| Oil | |||
| Oil India Ltd. | 2510000 | 8601.77 | 1.15 |
| Petroleum Products | |||
| Bharat Petroleum Corporation Ltd. | 13770000 | 32676.21 | 4.38 |
| Pharmaceuticals & Biotechnology | |||
| Dr Reddys Laboratories Ltd. | 2295000 | 25623.68 | 3.43 |
| Natco Pharma Ltd. | 1692000 | 13040.24 | 1.75 |
| Power | |||
| NTPC Ltd. | 7515000 | 23405.47 | 3.13 |
| Power Grid Corporation Of India Ltd. | 6300000 | 15803.55 | 2.12 |
| Realty | |||
| Raymond Ltd. | 761244 | 9845.55 | 1.32 |
| Retailing | |||
| Zomato Ltd. | 6660000 | 14791.86 | 1.98 |
| Telecom - Services | |||
| Indus Towers Ltd. | 7119000 | 23019.29 | 3.08 |
| Textiles & Apparels | |||
| Raymond Lifestyle Ltd. | 883320 | 9598.60 | 1.29 |
| Repo | 1305.91 | 0.17 | |
| Portfolio Total | 675578.73 | 90.48 | |
| Cash / Net Current Asset | 71262.91 | 9.52 | |
| Net Assets | 746841.64 | 100.00 | |
| Issuer Name | % to NAV |
| HDFC Bank Ltd. | 10.38 |
| Bpcl | 4.38 |
| Coal India Ltd. | 4.36 |
| Wipro Ltd. | 4.08 |
| Muthoot Finance Ltd. | 3.78 |
| Shriram Finance Ltd. | 3.50 |
| Radico Khaitan Ltd. | 3.49 |
| Dr. Reddys Labaratories Ltd. | 3.43 |
| ITC Ltd. | 3.34 |
| NTPC Ltd. | 3.13 |
| Total | 43.87 |
| Large Cap | 62.43% |
| Mid Cap | 14.08% |
| Small Cap | 23.49% |
| Market Capitalisation is as per list provided by AMFI. | |