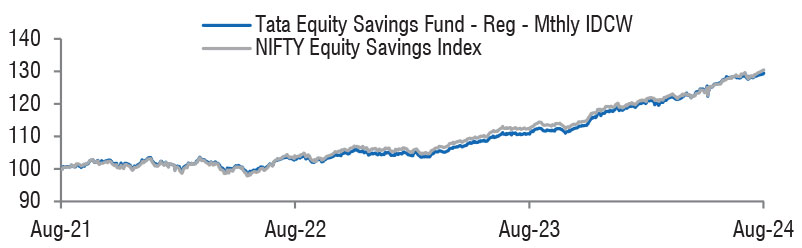
| Tata Equity Savings Fund
(An open-ended scheme investing in equity, arbitrage and debt) |
As on 28th February 2025


|
Predominantly investing in equity and equity related instruments, equity arbitrage opportunities and debt and money market instruments.
INVESTMENT OBJECTIVE:The investment objective of the scheme is to provide long term capital appreciation and income distribution to the investors by predominantly investing in equity and equity related instruments, equity arbitrage opportunities and investments in debt and money market instruments. However, there is no assurance or guarantee that the investment objective of the Scheme will be achieved. The scheme does not assure or guarantee any returns.
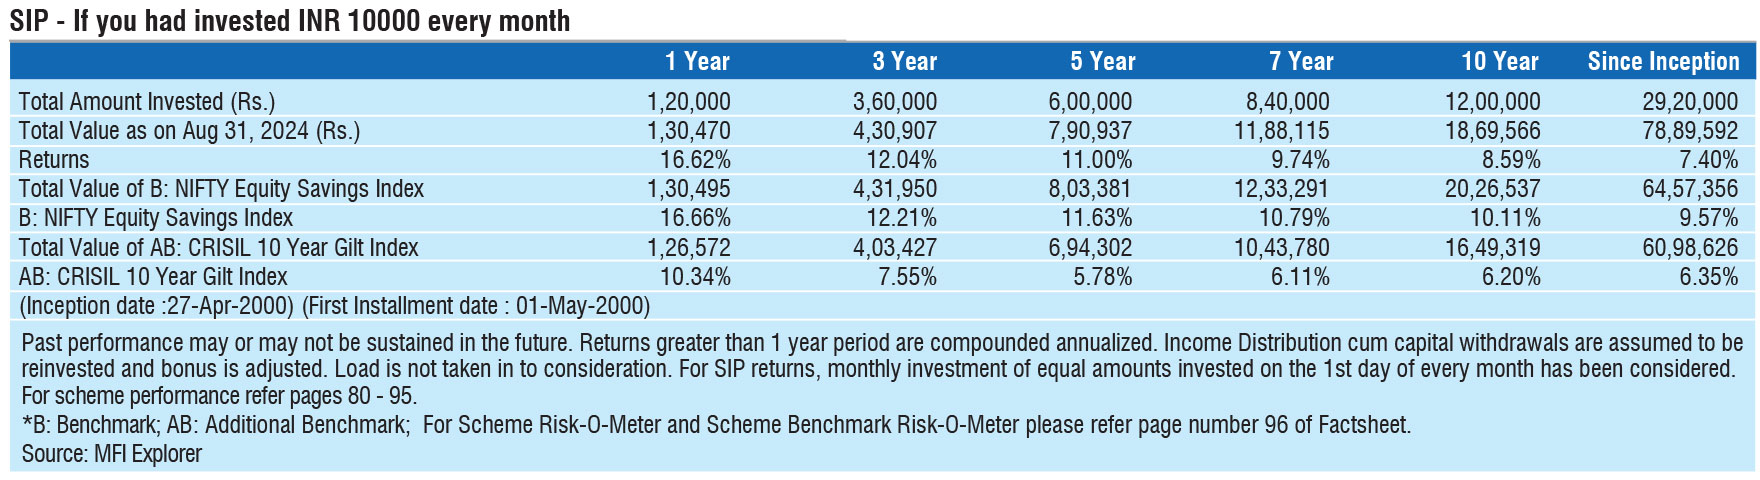
DATE OF ALLOTMENT:April 27, 2000
FUND MANAGER(S)Sailesh Jain (Managing Since 09-Nov-18 and overall experience of 22 years) (for equity portfolio), Murthy Nagarajan (Managing since 01-Apr-17 and overall experience of 28 years) (for Debt Portfolio) & Tapan Patel (Managing Since 11-Aug-23 and overall experience of 11 years)
BENCHMARK:NIFTY Equity Savings Index
NAV (in Rs.)| Monthly IDCW | : 16.9984 |
| Growth | : 52.3780 |
| Periodic IDCW | : 25.0922 |
| Direct - Growth | : 58.8932 |
| Direct - Monthly IDCW | : 20.6993 |
| Direct - Periodic IDCW | : 28.7763 |
| FUND SIZE | |
| Rs. 249.88 (Rs. in Cr.) | |
| MONTHLY AVERAGE AUM | |
| Rs. 250.22 (Rs. in Cr.) | |
| TURN OVER | |
| Portfolio Turnover (Equity component only) | 29.75% |
| EXPENSE RATIO** | |
| Direct | 0.50 |
| Regular | 1.14 |
| **Note: The rates specified are actual month end expenses charged as on Feb 28, 2025. The above ratio includes the GST on Investment Management Fees. The above ratio excludes, borrowing cost, wherever applicable. | |
| VOLATILITY MEASURES^ | FUND | BENCHMARK |
| Std. Dev (Annualised) | 4.05 | 4.71 |
| Sharpe Ratio | 0.48 | 0.37 |
| Portfolio Beta | 0.80 | NA |
| R Squared | 0.92 | NA |
| Treynor | 0.21 | NA |
| Jenson | 0.05 | NA |
| ^Risk-free rate based on the FBIL Overnight MIBOR rate of 6.4%
as on Feb 28, 2025 For calculation methodology | ||
| Portfolio Macaulay Duration | : | 3.61 Years |
| Modified Duration | : | 3.49 Years |
| Average Maturity | : | 4.79 Years |
| Annualized Yield to Maturity (For Debt Component)* - Including Net Current Assets | : | 6.99% |
| * Computed on the invested amount for debt portfolio. | ||
| Total stock in Portfolio | : | 40 |
MULTIPLES FOR NEW INVESTMENT:
Growth Option: Rs 5,000/- and in multiple of Re.1/- thereafter
IDCW Option : Rs 5,000/- and in multiple of Re.1/- thereafter
MULTIPLES FOR EXISTING INVESTORS:
Rs. 1,000/- and multiples of Re. 1/- thereafter.
LOAD STRUCTURE:| ENTRY LOAD | Not Applicable |
| EXIT LOAD |
Redemption / Switch out / SWP / STP before expiry of 7 days from
the date of allotment - 0.25% of NAV, Redemption / Switch out /
SWP / STP after expiry of 7 days from the date of allotment - NIL
|
Please refer to our Tata Mutual Fund website for fundamental changes, wherever applicable
| Company name | % of Assets | ||
| Equity & Equity Related Total | 65.76 | ||
| Unhedge Positions | 19.82 | ||
| Agricultural, Commercial & Construction Vehicles | |||
| Escorts Kubota Ltd. | 0.30 | ||
| Auto Components | |||
| Uno Minda Ltd. | 0.50 | ||
| Amara Raja Energy & Mobility Ltd. | 0.25 | ||
| Automobiles | |||
| Tvs Motor Company Ltd. | 0.42 | ||
| Banks | |||
| HDFC Bank Ltd. | 2.07 | ||
| ICICI Bank Ltd. | 1.95 | ||
| State Bank Of India | 0.49 | ||
| Indusind Bank Ltd. | 0.19 | ||
| Capital Markets | |||
| Central Depository Services (India) Ltd. | 0.42 | ||
| Cement & Cement Products | |||
| Ultratech Cement Ltd. | 0.27 | ||
| Ambuja Cements Ltd. | 0.13 | ||
| Construction | |||
| Larsen & Toubro Ltd. | 0.72 | ||
| Consumer Durables | |||
| Dixon Technologies (India) Ltd. | 0.60 | ||
| Diversified Fmcg | |||
| Hindustan Unilever Ltd. | 0.44 | ||
| ITC Ltd. | 0.20 | ||
| Electrical Equipment | |||
| Siemens Ltd. | 0.31 | ||
| Ferrous Metals | |||
| Jindal Stainless Ltd. | 0.24 | ||
| Finance | |||
| Bajaj Finserv Ltd. | 0.76 | ||
| Shriram Finance Ltd. | 0.54 | ||
| Rec Ltd. | 0.28 | ||
| Financial Technology (Fintech) | |||
| Pb Fintech Ltd. | 0.43 | ||
| It - Software | |||
| Persistent Systems Ltd. | 1.21 | ||
| Tata Consultancy Services Ltd. | 0.77 | ||
| Sonata Software Ltd. | 0.38 | ||
| Industrial Manufacturing | |||
| Titagarh Rail Systems Ltd. | 0.23 | ||
| Industrial Products | |||
| Cummins India Ltd. | 0.39 | ||
| Leisure Services | |||
| ITC Hotels Ltd. | 0.01 | ||
| Petroleum Products | |||
| Reliance Industries Ltd. | 1.58 | ||
| Pharmaceuticals & Biotechnology | |||
| Sun Pharmaceutical Industries Ltd. | 0.38 | ||
| Aurobindo Pharma Ltd. | 0.35 | ||
| Ajanta Pharma Ltd. | 0.35 | ||
| Zydus Lifesciences Ltd. | 0.33 | ||
| Power | |||
| NTPC Ltd. | 0.53 | ||
| Power Grid Corporation Of India Ltd. | 0.27 | ||
| Telecom - Services | |||
| Bharti Airtel Ltd. | 0.87 | ||
| Bharti Airtel Ltd. (Right 14/10/2021) (Partly Paid) | 0.06 | ||
| Transport Services | |||
| Interglobe Aviation Ltd. | 0.60 | ||
| Company Name | % to NAV | % to NAV Derivatives | |
| Hedge Positions | 45.94 | -46.14 | |
| Reliance Industries Ltd. | 4.42 | ||
| Reliance Industries Ltd.- Future | -4.44 | ||
| Bharti Airtel Ltd. | 4.39 | ||
| Bharti Airtel Ltd.- Future | -4.41 | ||
| Axis Bank Ltd. | 4.19 | ||
| Axis Bank Ltd.- Future | -4.22 | ||
| HDFC Bank Ltd. | 4.19 | ||
| HDFC Bank Ltd.- Future | -4.21 | ||
| Larsen & Toubro Ltd. | 3.95 | ||
| Larsen & Toubro Ltd.- Future | -3.97 | ||
| Hindustan Unilever Ltd. | 3.87 | ||
| Hindustan Unilever Ltd.- Future | -3.89 | ||
| NTPC Ltd. | 3.66 | ||
| NTPC Ltd.- Future | -3.68 | ||
| Ambuja Cements Ltd. | 3.65 | ||
| Ambuja Cements Ltd.- Future | -3.66 | ||
| State Bank Of India | 3.31 | ||
| State Bank Of India- Future | -3.33 | ||
| Adani Ports And Special Economic Zone Ltd. | 2.91 | ||
| Adani Ports And Special Economic Zone Ltd.- Future | -2.92 | ||
| Aurobindo Pharma Ltd. | 2.52 | ||
| Aurobindo Pharma Ltd.- Future | -2.53 | ||
| Interglobe Aviation Ltd. | 2.42 | ||
| Interglobe Aviation Ltd.- Future | -2.42 | ||
| Sbi Life Insurance Company Ltd. | 1.78 | ||
| Sbi Life Insurance Company Ltd.- Future | -1.78 | ||
| ACC Ltd. | 0.68 | ||
| ACC Ltd.- Future | -0.68 | ||
| COMMODITIES & COMMODITIES RELATED | |||
| COMMODITIES PHYSICAL | 6.41 | ||
| SILVER (30 K COMMODITY | 3.57 | ||
| SILVER MINI (5 KGS) COMMODITY | 2.84 | ||
| LISTED ON COMMODITY EXCHANGE (Quantity In Lots) | -5.66 | ||
| SILVER MINI (5 KGS) COMMODITY^ | -2.83 | ||
| SILVER (30 K COMMODITY^ | -3.62 | ||
| Name of the Instrument | Ratings | Market Value Rs. Lakhs | % to NAV |
| Debt Instruments | |||
| Government Securities | 4065.63 | 16.26 | |
| GOI - 7.10% (08/04/2034) | SOV | 3064.05 | 12.26 |
| GOI - 7.38% (20/06/2027) | SOV | 508.48 | 2.03 |
| GOI - 5.74% (15/11/2026) | SOV | 493.10 | 1.97 |
| Name of the Instrument | Units | Market Value Rs. Lakhs | % to NAV |
| Mutual Fund Units Related | 1315.84 | 5.26 | |
| Mutual Fund Units | |||
| Tata Money Market Fund | 16590.731 | 775.52 | 3.10 |
| Tata Short Term Bond Fund | 1055117.897 | 540.32 | 2.16 |
| Repo | 721.19 | 2.89 | |
| Portfolio Total | 24131.03 | 96.60 | |
| Cash / Net Current Asset | 856.70 | 3.40 | |
| Net Assets | 24987.73 | 100.00 | |
| Issuer Name | % to NAV |
| HDFC Bank Ltd. | 6.26 |
| Reliance Industries Ltd. | 6.00 |
| Bharti Airtel Ltd. | 5.32 |
| Larsen & Toubro Ltd. | 4.67 |
| Hindustan Unilever Ltd. | 4.31 |
| NTPC Ltd. | 4.20 |
| Axis Bank Ltd. | 4.19 |
| State Bank Of India | 3.80 |
| Ambuja Cements Ltd. | 3.79 |
| Interglobe Aviation Ltd. | 3.02 |
| Total | 45.56 |
| Large Cap | 72.45% |
| Mid Cap | 21.09% |
| Small Cap | 6.46% |
| Market Capitalisation is as per list provided by AMFI. | |