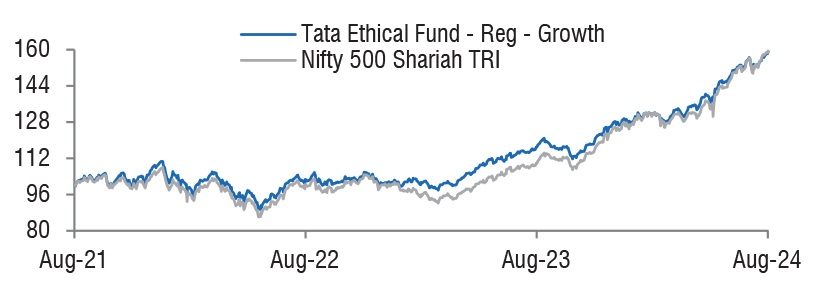
| Tata Ethical Fund
(An open ended equity scheme following Shariah principles) |
As on 28th February 2025


|
An equity scheme which invests primarily in equities of Shariah compliant companies and other instrument if allowed under Shariah principles.
INVESTMENT OBJECTIVE:To provide medium to long- term capital gains by investing in Shariah compliant equity and equity related instruments of well-researched value and growth - oriented companies. Tata Ethical Fund aims to generate medium to long term capital growth by investing in equity and equity related instruments of shariah compliant companies.
DATE OF ALLOTMENT:May 24,1996
FUND MANAGER(S)Abhinav Sharma (Managing Since 06-Sep-21 and overall experience of 18 years)
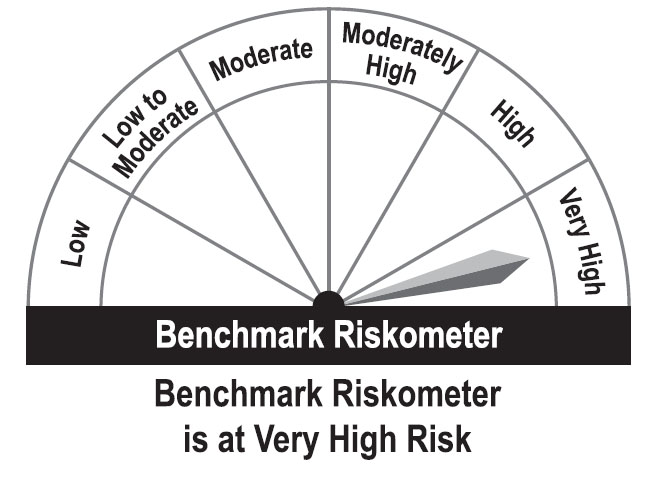
BENCHMARK:Nifty 500 Shariah TRI
NAV (in Rs.)| Direct - Growth | : 388.7248 |
| Direct - IDCW | : 213.3972 |
| Reg - Growth | : 342.0926 |
| Reg - IDCW | : 139.4299 |
| FUND SIZE | |
| Rs. 2980.72 (Rs. in Cr.) | |
| MONTHLY AVERAGE AUM | |
| Rs. 3161.94 (Rs. in Cr.) | |
| TURN OVER | |
| Portfolio Turnover (Equity component only) | 31.07% |
| EXPENSE RATIO** | |
| Direct | 0.70 |
| Regular | 1.95 |
| **Note: The rates specified are actual month end expenses charged as on Feb 28, 2025. The above ratio includes the GST on Investment Management Fees. The above ratio excludes, borrowing cost, wherever applicable. | |
| VOLATILITY MEASURES^ | FUND | BENCHMARK |
| Std. Dev (Annualised) | 14.28 | 15.98 |
| Sharpe Ratio | 0.17 | 0.21 |
| Portfolio Beta | 0.84 | NA |
| R Squared | 0.84 | NA |
| Treynor | 0.94 | NA |
| Jenson | -0.03 | NA |
| ^Risk-free rate based on the FBIL Overnight
MIBOR rate of 6.4% as on Feb 28, 2025 For calculation methodology | ||
MULTIPLES FOR NEW INVESTMENT:
Rs. 5,000/- and in multiples of Re. 1/- thereafter.
ADDITIONAL INVESTMENT/MULTIPLES FOR EXISTING INVESTORS:
Rs. 1,000/- and multiples of Re. 1/- thereafter.
LOAD STRUCTURE:| ENTRY LOAD | Not Applicable |
| EXIT LOAD | 0.50% of NAV if redeemed/switched out
on or before 90 days from the date of
allotment. |
Please refer to our Tata Mutual Fund website for fundamental changes, wherever applicable
| Company name | No. of Shares | Market Value Rs Lakhs | % of Assets |
| Equity & Equity Related Total | 269979.68 | 90.56 | |
| Agricultural Food & Other Products | |||
| Patanjali Foods Ltd. | 260000 | 4577.43 | 1.54 |
| Tata Consumer Products Ltd. | 259615 | 2501.91 | 0.84 |
| Auto Components | |||
| Zf Commercial Vehicle Control Systems India Ltd. | 29200 | 3195.03 | 1.07 |
| Endurance Technologies Ltd. | 179240 | 3164.93 | 1.06 |
| Sundram Fasteners Ltd. | 312000 | 2913.77 | 0.98 |
| Motherson Sumi Wiring India Ltd. | 5500440 | 2585.21 | 0.87 |
| MRF Ltd. | 2450 | 2581.66 | 0.87 |
| Uno Minda Ltd. | 292100 | 2412.45 | 0.81 |
| Schaeffler Ltd. | 61000 | 1867.36 | 0.63 |
| Automobiles | |||
| Hero Motocorp Ltd. | 147901 | 5444.38 | 1.83 |
| Cement & Cement Products | |||
| Ultratech Cement Ltd. | 82132 | 8318.70 | 2.79 |
| Shree Cement Ltd. | 29131 | 7948.10 | 2.67 |
| Chemicals & Petrochemicals | |||
| Srf Ltd. | 364174 | 10180.12 | 3.42 |
| Tata Chemicals Ltd. | 500000 | 3886.75 | 1.30 |
| Linde India Ltd. | 36650 | 2172.26 | 0.73 |
| Consumer Durables | |||
| Havells India Ltd. | 331672 | 4715.71 | 1.58 |
| Voltas Ltd. | 300000 | 3960.30 | 1.33 |
| Asian Paints (India) Ltd. | 122000 | 2659.30 | 0.89 |
| Crompton Greaves Consumer Electricals Ltd. | 770064 | 2473.06 | 0.83 |
| Century Plyboards (India) Ltd. | 320000 | 2308.64 | 0.77 |
| Relaxo Footwears Ltd. | 198169 | 846.58 | 0.28 |
| Diversified | |||
| 3M India Ltd. | 6934 | 1823.45 | 0.61 |
| Diversified Fmcg | |||
| Hindustan Unilever Ltd. | 569000 | 12462.52 | 4.18 |
| Electrical Equipment | |||
| Bharat Heavy Electricals Ltd. | 2050000 | 3672.99 | 1.23 |
| Fertilizers & Agrochemicals | |||
| Gujarat State Fertilizers &Chem Ltd. | 2225799 | 3728.88 | 1.25 |
| Pi Industries Ltd. | 105000 | 3164.65 | 1.06 |
| Food Products | |||
| Nestle India Ltd. | 115000 | 2518.10 | 0.84 |
| Gas | |||
| Indraprastha Gas Ltd. | 2194212 | 4157.59 | 1.39 |
| Petronet Lng Ltd. | 1293000 | 3663.07 | 1.23 |
| Gail ( India ) Ltd. | 1850000 | 2886.74 | 0.97 |
| Gujarat State Petronet Ltd. | 1040000 | 2831.40 | 0.95 |
| Gujarat Gas Ltd. | 580000 | 2148.03 | 0.72 |
| Healthcare Services | |||
| Fortis Healthcare Ltd. | 800000 | 4901.60 | 1.64 |
| Syngene International Ltd. | 531089 | 3464.82 | 1.16 |
| It - Services | |||
| Cyient Ltd. | 225635 | 2859.13 | 0.96 |
| It - Software | |||
| Tata Consultancy Services Ltd. | 477620 | 16636.70 | 5.58 |
| HCL Technologies Ltd. | 732000 | 11529.37 | 3.87 |
| Tech Mahindra Ltd. | 485000 | 7216.07 | 2.42 |
| Mphasis Ltd. | 170000 | 3820.33 | 1.28 |
| Birlasoft Ltd. | 850000 | 3604.43 | 1.21 |
| Ltimindtree Ltd. | 65004 | 3033.05 | 1.02 |
| Kpit Technologies Ltd. | 216034 | 2586.79 | 0.87 |
| Industrial Products | |||
| Cummins India Ltd. | 262000 | 7121.03 | 2.39 |
| Carborundum Universal Ltd. | 388000 | 3226.80 | 1.08 |
| Supreme Industries Ltd. | 63000 | 2097.27 | 0.70 |
| Astral Ltd. (Erstwhile Astral Poly Technik Ltd.) | 153777 | 2056.38 | 0.69 |
| Non - Ferrous Metals | |||
| National Aluminium Co. Ltd. | 1550000 | 2752.80 | 0.92 |
| Oil | |||
| Oil India Ltd. | 984401 | 3373.54 | 1.13 |
| Personal Products | |||
| Godrej Consumer Products Ltd. | 385000 | 3869.83 | 1.30 |
| Colgate-Palmolive India Ltd. | 132020 | 3253.76 | 1.09 |
| Emami Ltd. | 600000 | 3179.70 | 1.07 |
| Petroleum Products | |||
| Bharat Petroleum Corporation Ltd. | 3500000 | 8305.50 | 2.79 |
| Castrol India Ltd. | 1171818 | 2491.64 | 0.84 |
| Pharmaceuticals & Biotechnology | |||
| Dr Reddys Laboratories Ltd. | 590000 | 6587.35 | 2.21 |
| Cipla Ltd. | 435000 | 6122.63 | 2.05 |
| Alkem Laboratories Ltd. | 128600 | 5975.01 | 2.00 |
| Ipca Laboratories Ltd. | 289653 | 3925.81 | 1.32 |
| Sun Pharmaceutical Industries Ltd. | 241615 | 3849.53 | 1.29 |
| Lupin Ltd. | 200000 | 3809.30 | 1.28 |
| Aurobindo Pharma Ltd. | 300000 | 3174.90 | 1.07 |
| J.B.Chemicals & Pharmaceuticals Ltd. | 147000 | 2417.19 | 0.81 |
| Sanofi India Ltd. | 22295 | 1117.33 | 0.37 |
| Retailing | |||
| Avenue Supermarts Ltd. | 73000 | 2484.88 | 0.83 |
| Arvind Fashions Ltd. | 451135 | 1717.70 | 0.58 |
| Textiles & Apparels | |||
| Page Industries Ltd. | 9000 | 3646.44 | 1.22 |
| Portfolio Total | 269979.68 | 90.56 | |
| Cash / Net Current Asset | 28091.95 | 9.44 | |
| Net Assets | 298071.63 | 100.00 | |
| Issuer Name | % to NAV |
| Tata Consultancy Services Ltd. | 5.58 |
| Hindustan Unilever Ltd. | 4.18 |
| HCL Technologies Ltd. | 3.87 |
| Srf Ltd. | 3.42 |
| Bpcl | 2.79 |
| Ultratech Cement Ltd. | 2.79 |
| Shree Cement Ltd. | 2.67 |
| Tech Mahindra Ltd. | 2.42 |
| Cummins India Ltd. | 2.39 |
| Dr. Reddys Labaratories Ltd. | 2.21 |
| Total | 32.32 |
| Large Cap | 43.80% |
| Mid Cap | 39.39% |
| Small Cap | 16.81% |
| Market Capitalisation is as per list provided by AMFI. | |