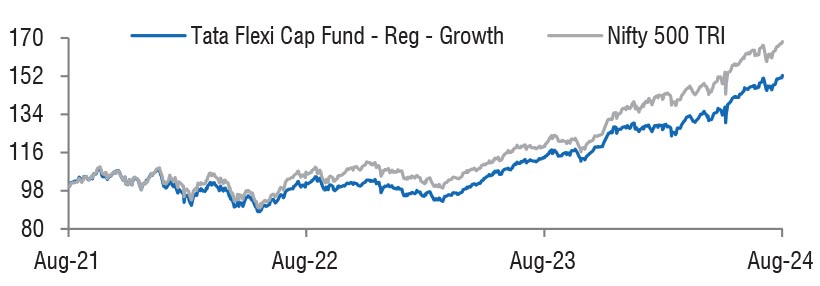
| Tata Flexi Cap Fund
(An open ended dynamic equity scheme investing across large cap, mid cap, small cap stocks.) |
As on 28th February 2025


|
Primarily focuses on investing in equity and equity related instruments of well researched companies across market capitalization.
INVESTMENT OBJECTIVE:The investment objective of the Scheme is to generate capital appreciation over medium to long term. However, there is no assurance or guarantee that the investment objective of the Scheme will be achieved. The scheme does not assure or guarantee any returns.
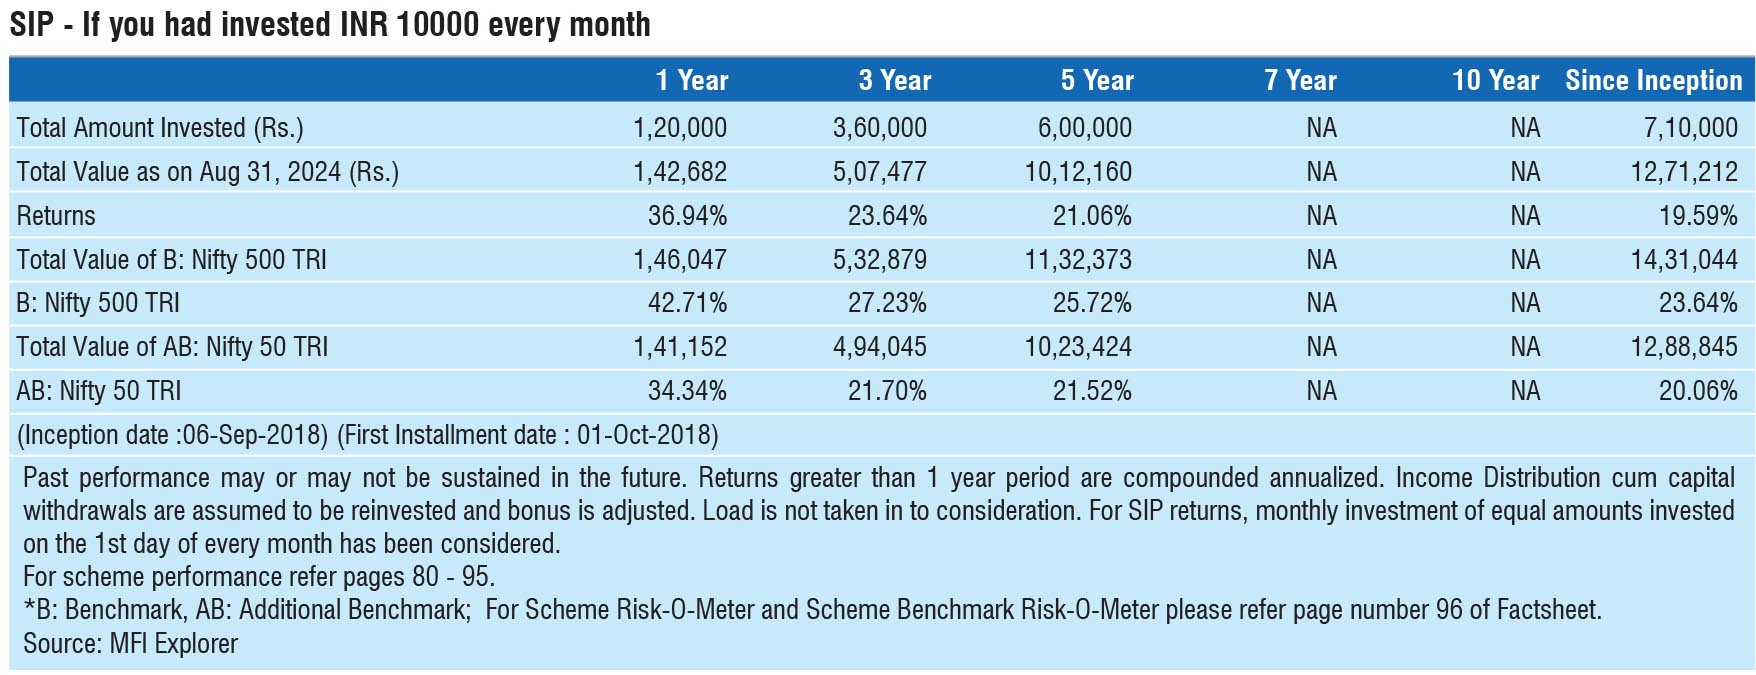
DATE OF ALLOTMENT:September 06,2018
FUND MANAGER(S)Amey Sathe (Managing Since 05-Apr-23 and overall experience of 17 years)
ASSISTANT FUND MANAGER:Aditya Bagul (Managing Since 03-Oct-23 and overall experience of 12 years)
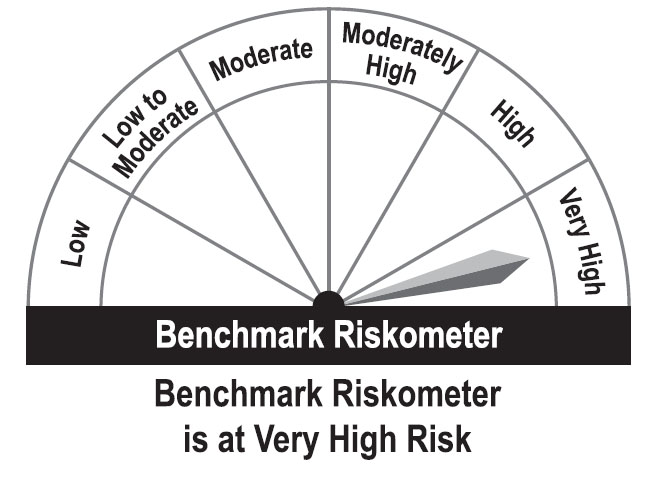
BENCHMARK:Nifty 500 TRI
NAV (in Rs.)| Direct - IDCW | : 23.3303 |
| Direct - Growth | : 23.3303 |
| Regular - IDCW | : 21.1176 |
| Regular - Growth | : 21.1176 |
| FUND SIZE | |
| Rs. 2733.96 (Rs. in Cr.) | |
| MONTHLY AVERAGE AUM | |
| Rs. 2838.59 (Rs. in Cr.) | |
| TURN OVER | |
| Portfolio Turnover (Equity component only) | 40.65% |
| EXPENSE RATIO** | |
| Direct | 0.70 |
| Regular | 1.97 |
| **Note: The rates specified are actual month end expenses charged as on Feb 28, 2025. The above ratio includes the GST on Investment Management Fees. The above ratio excludes, borrowing cost, wherever applicable. | |
| VOLATILITY MEASURES^ | FUND | BENCHMARK |
| Std. Dev (Annualised) | 12.20 | 14.47 |
| Sharpe Ratio | 0.47 | 0.46 |
| Portfolio Beta | 0.78 | NA |
| R Squared | 0.90 | NA |
| Treynor | 0.62 | NA |
| Jenson | 0.04 | NA |
| ^Risk-free rate based on the FBIL Overnight MIBOR rate of 6.4% as
on Feb 28, 2025 For calculation methodology | ||
MULTIPLES FOR NEW INVESTMENT:
Rs. 5,000/- and in multiples of Re. 1/- thereafter.
ADDITIONAL INVESTMENT/MULTIPLES FOR EXISTING INVESTORS:
Rs. 1,000/- and multiples of Re. 1/- thereafter.
LOAD STRUCTURE:| ENTRY LOAD | Not Applicable |
| EXIT LOAD |
1) Redemption/Switch-out/SWP/STP on or before expiry of 12
Months from the date of allotment: If the withdrawal amount
or switched out amount is not more than 12% of the original
cost of investment - NIL 2) Redemption/Switch-out/SWP/STP on or before expiry of 12 Months from the date of allotment: If the withdrawal amount or switched out amount is more than 12% of the original cost of investment - 1% 3) Redemption/Switch-out/SWP/STP after expiry of 12 Months from the date of allotment - NIL (w.e.f. 03 June, 2019) |
Please refer to our Tata Mutual Fund website for fundamental changes, wherever applicable
| Company Name | No. of Shares | Market Value Rs Lakhs | % of assets |
| Equity & Equity Related Total | 269496.70 | 98.54 | |
| Agricultural, Commercial & Construction Vehicles | |||
| Escorts Kubota Ltd. | 140000 | 4016.53 | 1.47 |
| Auto Components | |||
| Sundram Fasteners Ltd. | 478039 | 4464.41 | 1.63 |
| Automobiles | |||
| Maruti Suzuki India Ltd. | 80000 | 9556.68 | 3.50 |
| Banks | |||
| HDFC Bank Ltd. | 1550000 | 26852.20 | 9.82 |
| Kotak Mahindra Bank Ltd. | 600000 | 11417.70 | 4.18 |
| Axis Bank Ltd. | 1000000 | 10155.50 | 3.71 |
| ICICI Bank Ltd. | 700000 | 8428.70 | 3.08 |
| Indusind Bank Ltd. | 375000 | 3712.88 | 1.36 |
| Bandhan Bank Ltd. | 2100000 | 2964.99 | 1.08 |
| Rbl Bank Ltd. | 1700000 | 2691.78 | 0.98 |
| Capital Markets | |||
| Multi Commodity Exchange Of Ind Ltd. | 100000 | 4991.65 | 1.83 |
| Cement & Cement Products | |||
| Ambuja Cements Ltd. | 1200000 | 5579.40 | 2.04 |
| J K Cement Ltd. | 99842 | 4382.41 | 1.60 |
| The Ramco Cements Ltd. | 445000 | 3689.05 | 1.35 |
| Nuvoco Vistas Corporation Ltd. (Nirma Group) | 1040116 | 3260.24 | 1.19 |
| ACC Ltd. | 105605 | 1920.48 | 0.70 |
| Construction | |||
| Larsen & Toubro Ltd. | 260000 | 8226.01 | 3.01 |
| G R Infraprojects Ltd. | 325000 | 3267.39 | 1.20 |
| Consumer Durables | |||
| Metro Brands Ltd. | 400000 | 4468.60 | 1.63 |
| Titan Company Ltd. | 128000 | 3938.88 | 1.44 |
| Asian Paints (India) Ltd. | 120000 | 2615.70 | 0.96 |
| Diversified Fmcg | |||
| ITC Ltd. | 1800000 | 7110.00 | 2.60 |
| Ferrous Metals | |||
| Jsw Steel Ltd. | 489085 | 4649.73 | 1.70 |
| Finance | |||
| Sbi Cards And Payment Services Ltd. | 935000 | 7842.78 | 2.87 |
| Bajaj Finserv Ltd. | 400000 | 7489.20 | 2.74 |
| Pnb Housing Finance Ltd. | 700000 | 5343.45 | 1.95 |
| Home First Finance Company India Ltd. | 400000 | 4074.60 | 1.49 |
| Muthoot Finance Ltd. | 151233 | 3225.50 | 1.18 |
| Aptus Value Housing Finance India Ltd. | 943475 | 2901.66 | 1.06 |
| Food Products | |||
| Nestle India Ltd. | 180000 | 3941.37 | 1.44 |
| Healthcare Services | |||
| Apollo Hospitals Enterprise Ltd. | 90000 | 5447.34 | 1.99 |
| It - Software | |||
| Tata Consultancy Services Ltd. | 190000 | 6618.18 | 2.42 |
| Tech Mahindra Ltd. | 350000 | 5207.48 | 1.90 |
| Industrial Manufacturing | |||
| Syrma Sgs Technology Ltd. | 455192 | 1883.81 | 0.69 |
| Insurance | |||
| ICICI Prudential Life Insurance Company Ltd. | 700000 | 3861.20 | 1.41 |
| Go Digit General Insurance Ltd. | 1131648 | 3449.83 | 1.26 |
| Leisure Services | |||
| Westlife Foodworld Ltd. | 550000 | 3756.78 | 1.37 |
| ITC Hotels Ltd. | 180000 | 294.86 | 0.11 |
| Personal Products | |||
| Godrej Consumer Products Ltd. | 520000 | 5226.78 | 1.91 |
| Dabur India Ltd. | 650000 | 3206.45 | 1.17 |
| Petroleum Products | |||
| Reliance Industries Ltd. | 975000 | 11700.98 | 4.28 |
| Pharmaceuticals & Biotechnology | |||
| Suven Pharmaceuticals Ltd. | 513625 | 6239.00 | 2.28 |
| Piramal Pharma Ltd. | 2850000 | 5411.87 | 1.98 |
| Pfizer Ltd. | 90000 | 3645.68 | 1.33 |
| Realty | |||
| Embassy Office Parks Reit | 1200000 | 4370.88 | 1.60 |
| Mahindra Lifespace Developers Ltd. | 643700 | 2039.56 | 0.75 |
| Retailing | |||
| Avenue Supermarts Ltd. | 200000 | 6807.90 | 2.49 |
| Fsn E Commerce Ventures Ltd. | 3230672 | 5130.31 | 1.88 |
| Telecom - Services | |||
| Indus Towers Ltd. | 1141858 | 3692.20 | 1.35 |
| Transport Infrastructure | |||
| Adani Ports And Special Economic Zone Ltd. | 300000 | 3208.20 | 1.17 |
| Transport Services | |||
| Spicejet Ltd. | 2435065 | 1117.94 | 0.41 |
| Repo | 2489.15 | 0.91 | |
| Portfolio Total | 271985.85 | 99.45 | |
| Cash / Net Current Asset | 1409.94 | 0.55 | |
| Net Assets | 273395.79 | 100.00 | |
| Issuer Name | % to NAV |
| HDFC Bank Ltd. | 9.82 |
| Reliance Industries Ltd. | 4.28 |
| Kotak Mahindra Bank | 4.18 |
| Axis Bank Ltd. | 3.71 |
| Maruti Suzuki India Ltd. | 3.50 |
| ICICI Bank Ltd. | 3.08 |
| Larsen & Toubro Ltd. | 3.01 |
| Sbi Cards & Payment Services Ltd. | 2.87 |
| Bajaj Finserv Ltd. | 2.74 |
| ITC Ltd. | 2.60 |
| Total | 39.79 |
| Large Cap | 60.16% |
| Mid Cap | 15.25% |
| Small Cap | 24.59% |
| Market Capitalisation is as per list provided by AMFI. | |