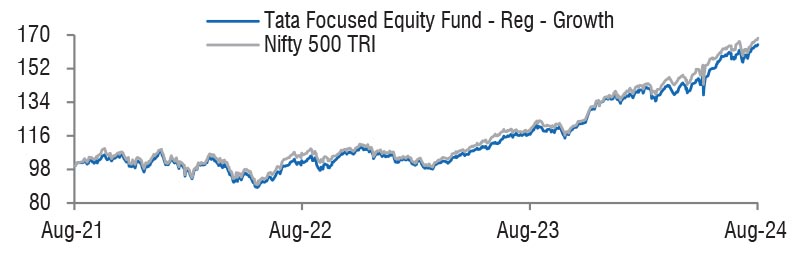
| Tata Focused Equity Fund
(An Open Ended Equity Scheme investing in maximum 30 stocks across market caps (i.e. Multi Cap)) |
As on 28th February 2025


|
Primarily focuses on investing in equity and equity related instruments of well researched companies across market capitalization.
INVESTMENT OBJECTIVE:The investment objective of the scheme is to generate long term capital appreciation by investing in equity & equity related instruments of maximum 30 stocks across market caps. However, there is no assurance or guarantee that the investment objective of the Scheme will be achieved. The scheme does not assure or guarantee any returns.
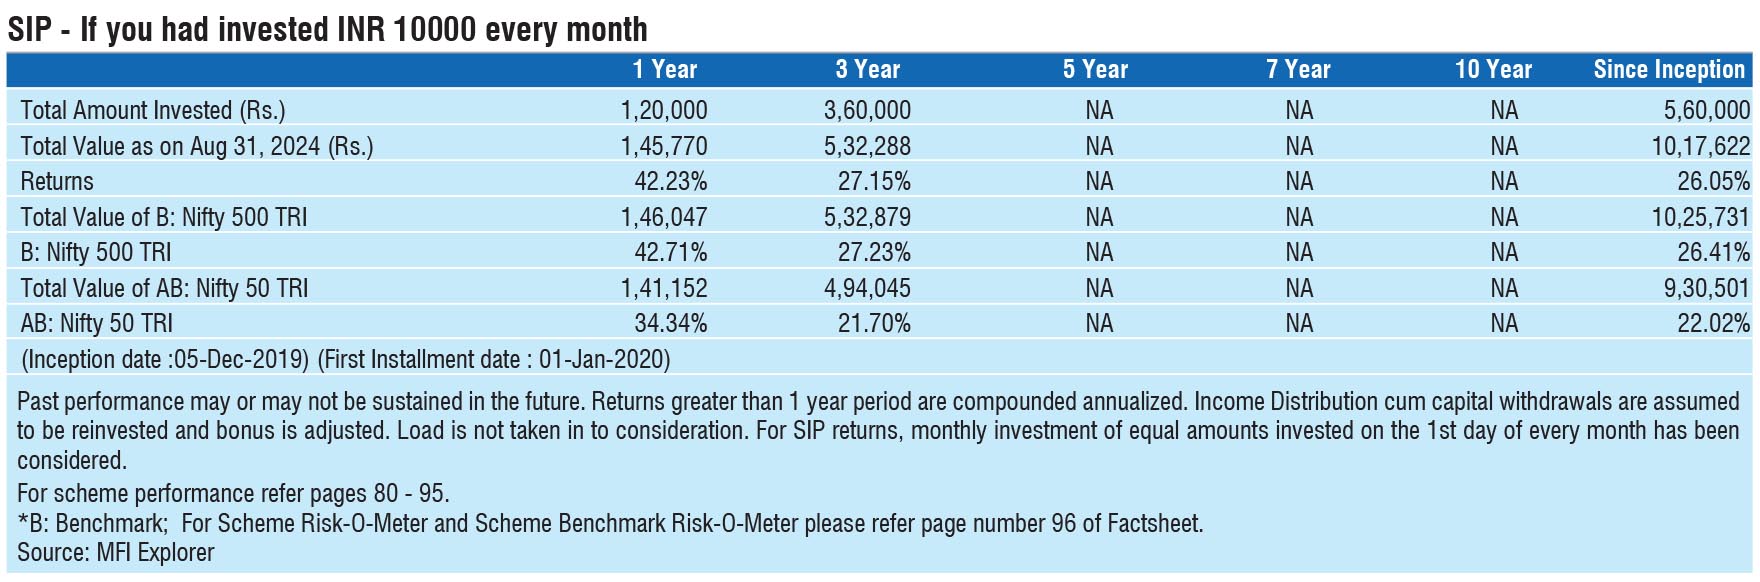
DATE OF ALLOTMENT:December 05, 2019
FUND MANAGER(S)Meeta Shetty (Managing Since 11-Apr-22 and overall experience of 18 years), Kapil Malhotra (Overseas Portfolio) (Managing Since 19-Dec-23 and overall experience of 15 years)
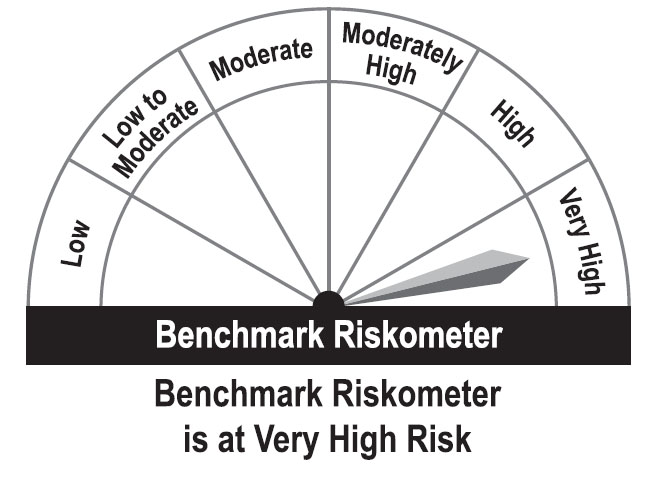
BENCHMARK:Nifty 500 TRI
NAV (in Rs.)| Direct - IDCW | : 22.6452 |
| Direct - Growth | : 22.6452 |
| Regular - IDCW | : 20.7236 |
| Regular - Growth | : 20.7236 |
| FUND SIZE | |
| Rs. 1635.33 (Rs. in Cr.) | |
| MONTHLY AVERAGE AUM | |
| Rs. 1705.33 (Rs. in Cr.) | |
| TURN OVER | |
| Portfolio Turnover (Equity component only) | 38.76% |
| EXPENSE RATIO** | |
| Direct | 0.66 |
| Regular | 2.08 |
| **Note: The rates specified are actual month end expenses charged as on Feb 28, 2025. The above ratio includes the GST on Investment Management Fees. The above ratio excludes, borrowing cost, wherever applicable. | |
| VOLATILITY MEASURES^ | FUND | BENCHMARK |
| Std. Dev (Annualised) | 14.52 | 14.47 |
| Sharpe Ratio | 0.45 | 0.46 |
| Portfolio Beta | 0.94 | NA |
| R Squared | 0.94 | NA |
| Treynor | 0.59 | NA |
| Jenson | 0.03 | NA |
| ^Risk-free rate based on the FBIL Overnight MIBOR rate of 6.4% as
on Feb 28, 2025 For calculation methodology | ||
MULTIPLES FOR NEW INVESTMENT:
Rs. 5,000/- and in multiples of Re. 1/- thereafter.
ADDITIONAL INVESTMENT/MULTIPLES FOR EXISTING INVESTORS:
Rs. 1,000/- and multiples of Re. 1/- thereafter.
LOAD STRUCTURE:| ENTRY LOAD | Not Applicable |
| EXIT LOAD |
• Exit Load is Nil, if the withdrawal
amount or switched out amount is not
more than 12% of the original cost of
investment on or before expiry of 365
days from the date of allotment. • Exit load is 1% of the applicable NAV if the withdrawal amount or switched out amount is more than 12% of the original cost of investment on or before expiry of 365 days from the date of allotment. • No Exit load will be charged for redemption or switch out after expiry of 365 days from the date of allotment. |
Please refer to our Tata Mutual Fund website for fundamental changes, wherever applicable
| Company Name | No. of Shares | Market Value Rs Lakhs | % of assets |
| Equity & Equity Related Total | 155923.32 | 95.33 | |
| Agricultural, Commercial & Construction Vehicles | |||
| Ashok Leyland Ltd. | 2550000 | 5429.97 | 3.32 |
| Auto Components | |||
| Samvardhana Motherson International Ltd. | 3563157 | 4225.55 | 2.58 |
| Craftsman Automation Ltd. | 81246 | 3657.57 | 2.24 |
| Banks | |||
| HDFC Bank Ltd. | 972000 | 16838.93 | 10.30 |
| Axis Bank Ltd. | 1148526 | 11663.86 | 7.13 |
| ICICI Bank Ltd. | 707680 | 8521.17 | 5.21 |
| Indusind Bank Ltd. | 771000 | 7633.67 | 4.67 |
| Cement & Cement Products | |||
| Ultratech Cement Ltd. | 35168 | 3561.97 | 2.18 |
| Commercial Services & Supplies | |||
| Firstsource Solutions Ltd. | 1972408 | 6824.53 | 4.17 |
| Construction | |||
| Kec International Ltd. | 726409 | 4986.43 | 3.05 |
| Larsen & Toubro Ltd. | 143941 | 4554.08 | 2.78 |
| Pnc Infratech Ltd. | 1146540 | 2968.97 | 1.82 |
| Consumer Durables | |||
| Amber Enterprises India Ltd. | 97816 | 5505.72 | 3.37 |
| Kajaria Ceramics Ltd. | 252173 | 2149.27 | 1.31 |
| Entertainment | |||
| Pvr Inox Ltd. | 87426 | 790.29 | 0.48 |
| Finance | |||
| Power Finance Corporation Ltd. | 872500 | 3178.52 | 1.94 |
| Healthcare Services | |||
| Healthcare Global Enterprises Ltd. | 758709 | 3806.06 | 2.33 |
| It - Software | |||
| Tech Mahindra Ltd. | 924690 | 13758.00 | 8.41 |
| Insurance | |||
| Sbi Life Insurance Company Ltd. | 260000 | 3719.30 | 2.27 |
| Leisure Services | |||
| Jubilant Foodworks Ltd. | 700000 | 4382.70 | 2.68 |
| Petroleum Products | |||
| Reliance Industries Ltd. | 555948 | 6671.93 | 4.08 |
| Pharmaceuticals & Biotechnology | |||
| Alkem Laboratories Ltd. | 105617 | 4907.18 | 3.00 |
| Lupin Ltd. | 174667 | 3326.80 | 2.03 |
| Power | |||
| NTPC Ltd. | 1315000 | 4095.57 | 2.50 |
| Adani Power Ltd. | 700000 | 3352.65 | 2.05 |
| Power Grid Corporation Of India Ltd. | 1056666 | 2650.65 | 1.62 |
| Realty | |||
| Godrej Properties Ltd. | 154162 | 2985.04 | 1.83 |
| Retailing | |||
| Zomato Ltd. | 4402043 | 9776.94 | 5.98 |
| Repo | 1146.35 | 0.70 | |
| Portfolio Total | 157069.67 | 96.03 | |
| Cash / Net Current Asset | 6463.41 | 3.97 | |
| Net Assets | 163533.08 | 100.00 | |
| Issuer Name | % to NAV |
| HDFC Bank Ltd. | 10.30 |
| Tech Mahindra Ltd. | 8.41 |
| Axis Bank Ltd. | 7.13 |
| Zomato Ltd. | 5.98 |
| ICICI Bank Ltd. | 5.21 |
| Indusind Bank Ltd. | 4.67 |
| Firstsource Solutions Ltd. | 4.17 |
| Reliance Industries Ltd. | 4.08 |
| Amber Enterprises India Ltd. | 3.37 |
| Ashok Leyland | 3.32 |
| Total | 56.64 |
| Large Cap | 61.93% |
| Mid Cap | 18.38% |
| Small Cap | 19.68% |
| Market Capitalisation is as per list provided by AMFI. | |