| Tata Hybrid Equity Fund
(An open ended hybrid scheme investing predominantly |
As on 28th February 2025


|
Invests 65% to 80% investment in Equity & equity related instruments & 20% to 35% in debt & money market instruments. For taxation purpose, it is treated as an equity scheme. (Monthly Income is not assured and is subject to availability of distributable surplus.)
INVESTMENT OBJECTIVE:The investment objective of the Scheme is to provide income distribution and or capital appreciation over medium to long term. However, there is no assurance or guarantee that the investment objective of the Scheme will be achieved. The scheme does not assure or guarantee any returns.
DATE OF ALLOTMENT:October 8, 1995
FUND MANAGER(S)Satish Chandra Mishra (Equity Portfolio) (Managing Since 15-Apr-24 and overall experience of 18 years) (Managed from 01-Nov-19 to 14-Apr-2024 as Assistant Fund Manger) , Murthy Nagarajan (Debt Portfolio) (Managing since 01-Apr-17 and overall experience of 28 years)
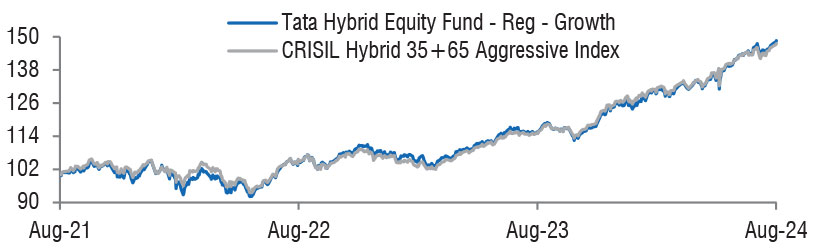
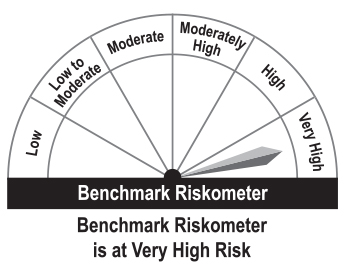
BENCHMARK:CRISIL Hybrid 35+65 Aggressive Index
NAV (in Rs.)| Direct - Growth | : 436.4261 |
| Direct - IDCW | : 102.4810 |
| Direct - Monthly IDCW | : 93.9178 |
| Reg - Growth | : 390.1395 |
| Reg - IDCW | : 86.2962 |
| Reg - Monthly IDCW | : 79.9575 |
| FUND SIZE | |
| Rs. 3733.13 (Rs. in Cr.) | |
| MONTHLY AVERAGE AUM | |
| Rs.3908.11 (Rs. in Cr.) | |
| TURN OVER | |
| Portfolio Turnover (Equity component only) | 32.16% |
| EXPENSE RATIO** | |
| Direct | 1.02 |
| Regular | 1.95 |
| **Note: The rates specified are actual month end expenses charged as on Feb 28, 2025. The above ratio includes the GST on Investment Management Fees. The above ratio excludes, borrowing cost, wherever applicable. | |
| VOLATILITY MEASURES^ | FUND | BENCHMARK |
| Std. Dev (Annualised) | 10.20 | 9.60 |
| Sharpe Ratio | 0.37 | 0.43 |
| Portfolio Beta | 1.00 | NA |
| R Squared | 0.94 | NA |
| Treynor | 0.32 | NA |
| Jenson | -0.02 | NA |
| ^Risk-free rate based on the FBIL Overnight MIBOR rate of 6.4% as
on Feb 28, 2025 For calculation methodology | ||
| Portfolio Macaulay Duration | : | 4.98 Years |
| Modified Duration | : | 4.76 Years |
| Average Maturity | : | 9.47 Years |
| Annualized Yield to Maturity (For Debt Component)* - Including Net Current Assets | : | 7.45% |
| * Computed on the invested amount for debt portfolio. | ||
| Total stock in Portfolio | : | 44 |
MULTIPLES FOR NEW INVESTMENT:
Rs. 5,000/- and in multiples of Re. 1/- thereafter.
ADDITIONAL INVESTMENT/MULTIPLES FOR EXISTING INVESTORS:
Rs. 1,000/- and multiples of Re. 1/- thereafter.
LOAD STRUCTURE:| ENTRY LOAD | Not Applicable |
| EXIT LOAD | 1) On or before expiry of 365 days from the date of allotment: If the
withdrawal amount or switched out amount is not more than 12% of
the original cost of investment: NIL 2) On or before expiry of 365 days from the date of allotment: If the withdrawal amount or switched out amount is more than 12% of the original cost of investment: 1% 3) Redemption after expiry of 365 days from the date of allotment: NIL (w.e.f 5th November, 2018) |
Please refer to our Tata Mutual Fund website for fundamental changes, wherever applicable
| Company name | No. of Shares | Market Value Rs Lakhs | % of Assets |
| Equity & Equity Related Total | 279907.98 | 74.98 | |
| Unhedge Positions | |||
| Auto Components | |||
| Sundram Fasteners Ltd. | 330000 | 3081.87 | 0.83 |
| Automobiles | |||
| Mahindra & Mahindra Ltd. | 260000 | 6721.26 | 1.80 |
| Hero Motocorp Ltd. | 104900 | 3861.47 | 1.03 |
| Maruti Suzuki India Ltd. | 30000 | 3583.76 | 0.96 |
| Tata Motors Ltd. | 495000 | 3072.22 | 0.82 |
| Banks | |||
| HDFC Bank Ltd. | 2000000 | 34648.00 | 9.28 |
| ICICI Bank Ltd. | 1250000 | 15051.25 | 4.03 |
| State Bank Of India | 1700000 | 11709.60 | 3.14 |
| Kotak Mahindra Bank Ltd. | 400000 | 7611.80 | 2.04 |
| IDFC First Bank Ltd. | 6200000 | 3620.18 | 0.97 |
| Axis Bank Ltd. | 350000 | 3554.43 | 0.95 |
| Beverages | |||
| Varun Beverages Ltd. | 1695375 | 7392.68 | 1.98 |
| Cement & Cement Products | |||
| Ultratech Cement Ltd. | 86000 | 8710.47 | 2.33 |
| Construction | |||
| Larsen & Toubro Ltd. | 431425 | 13649.64 | 3.66 |
| Pnc Infratech Ltd. | 1000000 | 2589.50 | 0.69 |
| Diversified Fmcg | |||
| ITC Ltd. | 1500000 | 5925.00 | 1.59 |
| Hindustan Unilever Ltd. | 270000 | 5913.68 | 1.58 |
| Fertilizers & Agrochemicals | |||
| Pi Industries Ltd. | 223500 | 6736.18 | 1.80 |
| Finance | |||
| Manappuram Finance Ltd. | 2500000 | 5024.00 | 1.35 |
| Muthoot Finance Ltd. | 220357 | 4699.77 | 1.26 |
| Gas | |||
| Gujarat State Petronet Ltd. | 1000000 | 2722.50 | 0.73 |
| Healthcare Services | |||
| Max Healthcare Institute Ltd. | 337829 | 3304.31 | 0.89 |
| It - Software | |||
| Infosys Ltd. | 800000 | 13501.60 | 3.62 |
| Tata Consultancy Services Ltd. | 300000 | 10449.75 | 2.80 |
| Industrial Products | |||
| Cummins India Ltd. | 100000 | 2717.95 | 0.73 |
| Aia Engineering Ltd. | 67989 | 2135.70 | 0.57 |
| Insurance | |||
| HDFC Life Insurance Co. Ltd. | 500000 | 3042.50 | 0.81 |
| Personal Products | |||
| Dabur India Ltd. | 700000 | 3453.10 | 0.92 |
| Petroleum Products | |||
| Reliance Industries Ltd. | 1760000 | 21121.76 | 5.66 |
| Pharmaceuticals & Biotechnology | |||
| Granules India Ltd. | 1100000 | 5079.80 | 1.36 |
| Lupin Ltd. | 250000 | 4761.63 | 1.28 |
| Sun Pharmaceutical Industries Ltd. | 224516 | 3577.10 | 0.96 |
| Aurobindo Pharma Ltd. | 300000 | 3174.90 | 0.85 |
| Power | |||
| Adani Energy Solutions Ltd. | 436475 | 2841.02 | 0.76 |
| Power Grid Corporation Of India Ltd. | 1000000 | 2508.50 | 0.67 |
| Realty | |||
| Anant Raj Ltd. | 660268 | 3058.69 | 0.82 |
| Oberoi Realty Ltd. | 130000 | 1929.85 | 0.52 |
| Retailing | |||
| Zomato Ltd. | 2000000 | 4442.00 | 1.19 |
| Arvind Fashions Ltd. | 910000 | 3464.83 | 0.93 |
| Telecom - Services | |||
| Bharti Airtel Ltd. | 1050000 | 16487.10 | 4.42 |
| Tata Communications Ltd. | 150000 | 2028.75 | 0.54 |
| Transport Infrastructure | |||
| Adani Ports And Special Economic Zone Ltd. | 300000 | 3208.20 | 0.86 |
| Gujarat Pipavav Port Ltd. | 1800000 | 2249.10 | 0.60 |
| Transport Services | |||
| Spicejet Ltd. | 3246754 | 1490.58 | 0.40 |
| Name of the Instrument | Ratings | Market Value Rs. Lakhs | % to NAV |
| Debt Instruments | |||
| Government Securities | 44392.56 | 11.85 | |
| GOI - 7.09% (05/08/2054) | SOV | 8451.93 | 2.26 |
| GOI - 7.34% (22/04/2064) | SOV | 7171.33 | 1.92 |
| GOI - 7.38% (20/06/2027) | SOV | 3941.37 | 1.06 |
| GOI - 7.18% (14/08/2033) | SOV | 3842.18 | 1.03 |
| Sgs Gujarat 7.64% (10/01/2031) | SOV | 3598.11 | 0.96 |
| GOI - 7.32% (13/11/2030) | SOV | 2573.55 | 0.69 |
| GOI - 7.17% (17/04/2030) | SOV | 2552.30 | 0.68 |
| GOI - 5.63% (12/04/2026) | SOV | 2474.89 | 0.66 |
| GOI - 7.02% (18/06/2031) | SOV | 1950.10 | 0.52 |
| SDL Gujarat 7.80% (27/12/2027) | SOV | 1023.75 | 0.27 |
| Sgs Maharashtra 7.45% (20/03/2037) | SOV | 1020.68 | 0.27 |
| Sgs Maharashtra 7.49% (07/02/2036) | SOV | 775.55 | 0.21 |
| GOI - 7.36% (12/09/2052) | SOV | 515.30 | 0.14 |
| Sgs Tamilnadu 7.44% (05/06/2034) | SOV | 509.13 | 0.14 |
| GOI - 7.26% (22/08/2032) | SOV | 514.26 | 0.14 |
| GOI - 6.92% (18/11/2039) | SOV | 501.11 | 0.13 |
| Sgs Uttar Pradesh 7.62% (20/12/2034) | SOV | 463.03 | 0.12 |
| GOI - 7.27% (08/04/2026) | SOV | 447.23 | 0.12 |
| Sgs Maharashtra 7.63% (31/01/2035) | SOV | 309.88 | 0.08 |
| GOI - 7.10% (08/04/2034) | SOV | 316.52 | 0.08 |
| Sgs Maharashtra 7.63% (31/01/2036) | SOV | 310.18 | 0.08 |
| Sgs Tamilnadu 7.42% (03/04/2034) | SOV | 239.55 | 0.06 |
| Sgs West Bengal 7.53% (27/03/2044) | SOV | 170.48 | 0.05 |
| SDL Uttar Pradesh 7.85% (27/12/2027) | SOV | 204.90 | 0.05 |
| GOI - 8.13% (22/06/2045) | SOV | 100.73 | 0.03 |
| GOI - 7.25% (12/06/2063) | SOV | 89.44 | 0.02 |
| Sgs Maharashtra 7.21% (21/08/2035) | SOV | 77.27 | 0.02 |
| GOI - 8.30% (02/07/2040) | SOV | 82.33 | 0.02 |
| SDL Tamilnadu 8.14% (27/05/2025) | SOV | 48.67 | 0.01 |
| GOI - 7.26% (06/02/2033) | SOV | 41.59 | 0.01 |
| GOI - 7.26% (14/01/2029) | SOV | 29.84 | 0.01 |
| GOI - 6.19% (16/09/2034) | SOV | 30.26 | 0.01 |
| GOI - 6.57% (05/12/2033) | SOV | 1.97 | 0.00 |
| SDL Maharashtra 7.33% (13/09/2027) | SOV | 13.15 | 0.00 |
| Non-Convertible Debentures/Bonds | 34304.64 | 9.18 | |
| 07.69 % LIC Housing Finance Ltd. | CRISIL AAA | 4537.74 | 1.22 |
| 06.75 % Sikka Ports And Terminals Ltd. (Mukesh Ambani Group) | CRISIL AAA | 2867.96 | 0.77 |
| 08.75 % Bharti Telecom Ltd. | CRISIL AA+ | 2536.55 | 0.68 |
| 08.15 % Godrej Properties Ltd. | ICRA AA+ | 2499.74 | 0.67 |
| 08.25 % Toyota Financial Services India Ltd. | CRISIL AAA | 2503.53 | 0.67 |
| 07.40 % Nabard | CRISIL AAA | 2494.06 | 0.67 |
| 07.55 % Power Finance Corporation | CRISIL AAA | 2498.72 | 0.67 |
| 08.50 % Cholamandalam Invt & Fin Co Ltd. | ICRA AA+ | 2511.02 | 0.67 |
| 08.45 % Can Fin Homes Ltd. | IND AA+ | 2512.25 | 0.67 |
| 09.10 % Cholamandalam Invt & Fin Co Ltd. | ICRA AA+ | 2500.41 | 0.67 |
| 07.97 % Kotak Mahindra Investments Ltd. | CRISIL AAA | 2499.30 | 0.67 |
| 06.40 % Jamnagar Utilities & Power Pvt. Ltd. (Mukesh Ambani Group) | CRISIL AAA | 2450.44 | 0.66 |
| 07.13 % Nhpc Ltd. | ICRA AAA | 496.87 | 0.13 |
| 08.10 % ICICI Home Finance Co.Ltd. | CRISIL AAA | 502.27 | 0.13 |
| 08.15 % HDFC Ergo General Insurance Company Ltd. | CRISIL AAA | 502.13 | 0.13 |
| 06.92 % Indian Railways Finance Corporation Ltd. | CRISIL AAA | 391.65 | 0.10 |
| Name of the Instrument | Units | Market Value Rs. Lakhs | % to NAV |
| Mutual Fund Units Related | 5149.22 | 1.38 | |
| Mutual Fund Units | |||
| Tata Corporate Bond Fund | 42248314.31 | 5149.22 | 1.38 |
| Repo | 261.81 | 0.07 | |
| Portfolio Total | 364016.21 | 97.46 | |
| Cash / Net Current Asset | 9297.18 | 2.54 | |
| Net Assets | 373313.39 | 100.00 | |
| Issuer Name | % to NAV |
| HDFC Bank Ltd. | 9.28 |
| Reliance Industries Ltd. | 5.66 |
| Bharti Airtel Ltd. | 4.42 |
| ICICI Bank Ltd. | 4.03 |
| Larsen & Toubro Ltd. | 3.66 |
| Infosys Ltd. | 3.62 |
| State Bank Of India | 3.14 |
| Tata Consultancy Services Ltd. | 2.80 |
| Ultratech Cement Ltd. | 2.33 |
| Kotak Mahindra Bank | 2.04 |
| Total | 40.98 |
| Large Cap | 78.15% |
| Mid Cap | 11.57% |
| Small Cap | 10.28% |
| Market Capitalisation is as per list provided by AMFI. | |