| Tata India Consumer Fund
(An open ended equity scheme investing in |
As on 28th February 2025


|
Primarily focuses on investment in at least 80% of its net assets in equity/equity related instruments of the companies in the Consumption Oriented sectors in India.
INVESTMENT OBJECTIVE:The investment objective of the scheme is to seek long term capital appreciation by investing atleast 80% of its assets in equity/equity related instruments of the companies in the Consumption Oriented sectors in India.However, there is no assurance or guarantee that the investment objective of the Scheme will be achieved.The Scheme does not assure or guarantee any returns.
DATE OF ALLOTMENT:December 28, 2015
FUND MANAGER(S)Sonam Udasi (Managing Since 01-Apr-16 and overall experience of 27 years)
ASSISTANT FUND MANAGER:Aditya Bagul (Managing Since 03-Oct-23 and overall experience of 12 years)
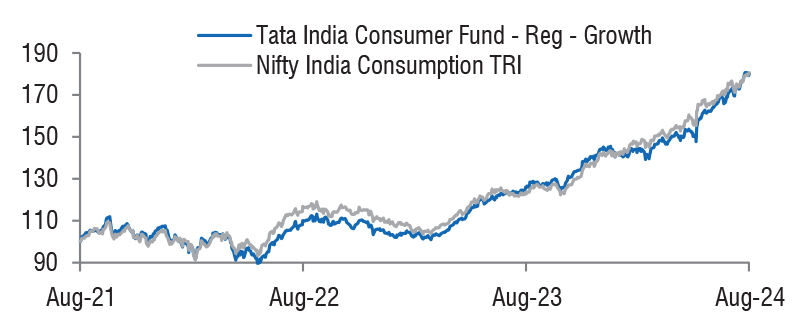
BENCHMARK:Nifty India Consumption TRI
NAV (in Rs.)| Direct - IDCW | : 44.3824 |
| Direct - Growth | : 44.3824 |
| Regular - IDCW | : 35.7389 |
| Regular - Growth | : 38.7560 |
| FUND SIZE | |
| Rs. 2113.62 (Rs. in Cr.) | |
| MONTHLY AVERAGE AUM | |
| Rs.2227.05 (Rs. in Cr.) | |
| TURN OVER | |
| Portfolio Turnover (Equity component only) | 51.61% |
| EXPENSE RATIO** | |
| Direct | 0.79 |
| Regular | 2.05 |
| **Note: The rates specified are actual month end expenses charged as on Feb 28, 2025. The above ratio includes the GST on Investment Management Fees. The above ratio excludes, borrowing cost, wherever applicable. | |
| VOLATILITY MEASURES^ | FUND | BENCHMARK |
| Std. Dev (Annualised) | 16.23 | 15.85 |
| Sharpe Ratio | 0.59 | 0.59 |
| Portfolio Beta | 0.90 | NA |
| R Squared | 0.82 | NA |
| Treynor | 0.89 | NA |
| Jenson | 0.09 | NA |
| ^Risk-free rate based on the FBIL Overnight MIBOR rate of 6.4% as
on Feb 28, 2025 For calculation methodology | ||
MULTIPLES FOR NEW INVESTMENT:
Rs. 5,000/- and in multiples of Re. 1/- thereafter.
ADDITIONAL INVESTMENT/MULTIPLES FOR EXISTING INVESTORS:
Rs. 1,000/- and multiples of Re. 1/- thereafter.
LOAD STRUCTURE:| ENTRY LOAD | Not Applicable |
| EXIT LOAD | 0.25% of NAV if redeemed/switched out
before 30 days from the date of allotment. |
Please refer to our Tata Mutual Fund website for fundamental changes, wherever applicable
| Company name | No. of Shares | Market Value Rs Lakhs | % of Assets |
| Equity & Equity Related Total | 189610.41 | 89.75 | |
| Agricultural Food & Other Products | |||
| Tata Consumer Products Ltd. | 918000 | 8846.77 | 4.19 |
| Auto Components | |||
| Pricol Ltd. | 462000 | 1838.07 | 0.87 |
| Automobiles | |||
| Maruti Suzuki India Ltd. | 41000 | 4897.80 | 2.32 |
| Hero Motocorp Ltd. | 90000 | 3312.99 | 1.57 |
| Bajaj Auto Ltd. | 36000 | 2845.04 | 1.35 |
| Beverages | |||
| Radico Khaitan Ltd. | 596500 | 12365.74 | 5.85 |
| United Spirits Ltd. | 279000 | 3583.62 | 1.70 |
| Capital Markets | |||
| Bse Ltd. | 72000 | 3336.26 | 1.58 |
| Chemicals & Petrochemicals | |||
| Pidilite Industries Ltd. | 90000 | 2392.11 | 1.13 |
| Commercial Services & Supplies | |||
| Teamlease Services Ltd. | 81000 | 1578.69 | 0.75 |
| Consumer Durables | |||
| Titan Company Ltd. | 216000 | 6646.86 | 3.14 |
| Dixon Technologies (India) Ltd. | 45000 | 6271.13 | 2.97 |
| Blue Star Ltd. | 270464 | 5186.55 | 2.45 |
| Metro Brands Ltd. | 456797 | 5103.11 | 2.41 |
| Pg Electroplast Ltd. | 630000 | 5007.24 | 2.37 |
| Amber Enterprises India Ltd. | 63898 | 3596.59 | 1.70 |
| Greenpanel Industries Ltd. | 1227500 | 3301.36 | 1.56 |
| Voltas Ltd. | 216000 | 2851.42 | 1.35 |
| Kalyan Jewellers India Ltd. | 504000 | 2329.74 | 1.10 |
| Campus Activewear Ltd. | 810000 | 2111.27 | 1.00 |
| Cello World Ltd. | 163909 | 907.89 | 0.43 |
| Diversified Fmcg | |||
| ITC Ltd. | 5319000 | 21010.05 | 9.94 |
| Financial Technology (Fintech) | |||
| Pb Fintech Ltd. | 230657 | 3375.90 | 1.60 |
| Food Products | |||
| Nestle India Ltd. | 405000 | 8868.08 | 4.20 |
| Bikaji Foods International Ltd. | 1215000 | 7704.92 | 3.65 |
| Godrej Agrovet Ltd. | 315000 | 2252.72 | 1.07 |
| Household Products | |||
| Doms Industries Ltd. | 315000 | 7580.63 | 3.59 |
| Jyothy Labs Ltd. | 843244 | 2718.62 | 1.29 |
| Flair Writing Industries Ltd. | 658830 | 1410.56 | 0.67 |
| Industrial Manufacturing | |||
| Kaynes Technology India Ltd. | 51300 | 2125.95 | 1.01 |
| Industrial Products | |||
| Polycab India Ltd. | 81000 | 3817.85 | 1.81 |
| Leisure Services | |||
| Indian Railway Catering And Tourism Corporation Ltd. | 612000 | 4106.21 | 1.94 |
| Restaurant Brands Asia Ltd. | 5000000 | 3189.00 | 1.51 |
| Personal Products | |||
| Gillette India Ltd. | 15000 | 1182.80 | 0.56 |
| Realty | |||
| Raymond Ltd. | 50070 | 647.58 | 0.31 |
| Retailing | |||
| Zomato Ltd. | 8568000 | 19029.53 | 9.00 |
| Trent Ltd. | 234000 | 11352.63 | 5.37 |
| Textiles & Apparels | |||
| Raymond Lifestyle Ltd. | 85320 | 927.13 | 0.44 |
| Repo | 428.30 | 0.20 | |
| Portfolio Total | 190038.71 | 89.95 | |
| Cash / Net Current Asset | 21323.14 | 10.05 | |
| Net Assets | 211361.85 | 100.00 | |
| Issuer Name | % to NAV |
| ITC Ltd. | 9.94 |
| Zomato Ltd. | 9.00 |
| Radico Khaitan Ltd. | 5.85 |
| Trent Ltd. | 5.37 |
| Nestle India Ltd. | 4.20 |
| Tata Consumer Products Ltd. | 4.19 |
| Bikaji Foods International Ltd | 3.65 |
| Doms Industries Ltd | 3.59 |
| Titan Company Ltd. | 3.14 |
| Dixon Technologies (india) Ltd. | 2.97 |
| Total | 51.90 |

| Large Cap | 50.95% |
| Mid Cap | 18.29% |
| Small Cap | 30.76% |
| Market Capitalisation is as per list provided by AMFI. | |