| Tata India Pharma & Healthcare Fund
(An open ended equity scheme investing in Pharma |
As on 28th February 2025


|
Primarily focuses on investment in at least 80% of its net assets in equity/equity related instruments of the companies in the Pharma & Healthcare sectors in India.
INVESTMENT OBJECTIVE:The investment objective of the scheme is to seek long term capital appreciation by investing atleast 80% of its net assets in equity/equity related instruments of the companies in the pharma & healthcare sectors in India.However, there is no assurance or guarantee that the investment objective of the Scheme will be achieved.The Scheme does not assure or guarantee any returns.
DATE OF ALLOTMENT:December 28,2015
FUND MANAGER(S)Meeta Shetty (Managing Since 09-Mar-21 and overall experience of 18 years) (Managed in the past from 09-Nov-2018 to 08-March- 2021 as Lead Fund Manager)
ASSISTANT FUND MANAGER:Rajat Srivastava (Managing Since 16-Sep-24 and overall experience of 10 years)
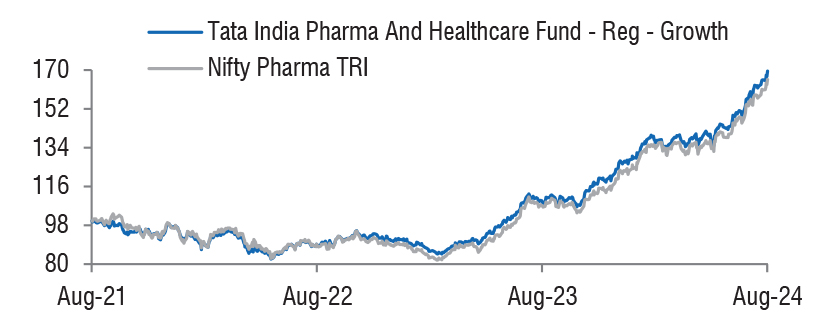
BENCHMARK:Nifty Pharma TRI
NAV (in Rs.)| Direct - IDCW | 30.7180 |
| Direct - Growth | 30.7180 |
| Reg - IDCW | 26.5729 |
| Reg - Growth | 26.5729 |
| FUND SIZE | |
| Rs. 1103.99(Rs. in Cr.) | |
| MONTHLY AVERAGE AUM | |
| Rs. 1182.81 (Rs. in Cr.) | |
| TURN OVER | |
| Portfolio Turnover (Equity component only) | 5.10% |
| EXPENSE RATIO** | |
| Direct | 0.74 |
| Regular | 2.19 |
| **Note: The rates specified are actual month end expenses charged as on Feb 28, 2025. The above ratio includes the GST on Investment Management Fees. The above ratio excludes, borrowing cost, wherever applicable. | |
| VOLATILITY MEASURES^ | FUND | BENCHMARK |
| Std. Dev (Annualised) | 16.54 | 17.21 |
| Sharpe Ratio | 0.67 | 0.59 |
| Portfolio Beta | 0.92 | NA |
| R Squared | 0.97 | NA |
| Treynor | 1.02 | NA |
| Jenson | 0.15 | NA |
| ^Risk-free rate based on the FBIL Overnight MIBOR rate of 6.4% as
on Feb 28, 2025 For calculation methodology | ||
MULTIPLES FOR NEW INVESTMENT:
Rs. 5,000/- and in multiples of Re. 1/- thereafter.
ADDITIONAL INVESTMENT/MULTIPLES FOR EXISTING INVESTORS:
Rs. 1,000/- and multiples of Re. 1/- thereafter.
LOAD STRUCTURE:| ENTRY LOAD | Not Applicable |
| EXIT LOAD | 0.25% of NAV if redeemed/switched out
before 30 days from the date of allotment. |
Please refer to our Tata Mutual Fund website for fundamental changes, wherever applicable
| Company name | No. of Shares | Market Value Rs Lakhs | % of Assets |
| Equity & Equity Related Total | 108256.13 | 98.05 | |
| Chemicals & Petrochemicals | |||
| Deepak Nitrite Ltd. | 17909 | 331.55 | 0.30 |
| Fertilizers & Agrochemicals | |||
| Coromandel International Ltd. | 60000 | 1000.17 | 0.91 |
| Healthcare Equipment & Supplies | |||
| Laxmi Dental Ltd. | 14357 | 48.71 | 0.04 |
| Healthcare Services | |||
| Fortis Healthcare Ltd. | 855100 | 5239.20 | 4.75 |
| Apollo Hospitals Enterprise Ltd. | 72635 | 4396.31 | 3.98 |
| Aster Dm Healthcare Ltd. | 906991 | 3654.72 | 3.31 |
| Healthcare Global Enterprises Ltd. | 566121 | 2839.95 | 2.57 |
| Dr. Agarwals Health Care Ltd. | 455187 | 1825.30 | 1.65 |
| Dr. Lal Path Labs Ltd. | 70000 | 1617.32 | 1.46 |
| Jupiter Life Line Hospitals Ltd. | 106389 | 1527.43 | 1.38 |
| Metropolis Healthcare Ltd. | 77134 | 1222.19 | 1.11 |
| Syngene International Ltd. | 107046 | 698.37 | 0.63 |
| It - Services | |||
| Inventurus Knowledge Solutions Ltd. | 41742 | 749.16 | 0.68 |
| Insurance | |||
| Medi Assist Healthcare Services Ltd. | 418670 | 1891.13 | 1.71 |
| Pharmaceuticals & Biotechnology | |||
| Sun Pharmaceutical Industries Ltd. | 804300 | 12814.51 | 11.61 |
| Dr Reddys Laboratories Ltd. | 714555 | 7978.01 | 7.23 |
| Aurobindo Pharma Ltd. | 741000 | 7842.00 | 7.10 |
| Cipla Ltd. | 490000 | 6896.75 | 6.25 |
| Lupin Ltd. | 360240 | 6861.31 | 6.22 |
| Divi Laboratories Ltd. | 104965 | 5752.34 | 5.21 |
| Zydus Lifesciences Ltd. | 471287 | 4131.30 | 3.74 |
| Alkem Laboratories Ltd. | 75249 | 3496.22 | 3.17 |
| Wockhardt Ltd. | 274871 | 3176.13 | 2.88 |
| Laurus Labs Ltd. | 505000 | 2662.36 | 2.41 |
| Ajanta Pharma Ltd. | 94737 | 2355.11 | 2.13 |
| Torrent Pharmaceuticals Ltd. | 70921 | 2090.82 | 1.89 |
| Ipca Laboratories Ltd. | 142452 | 1930.72 | 1.75 |
| Fdc Ltd. | 471283 | 1799.83 | 1.63 |
| Orchid Pharma Ltd. | 175000 | 1681.84 | 1.52 |
| Indoco Remedies Ltd. | 666992 | 1310.44 | 1.19 |
| Akums Drugs And Pharmaceuticals Ltd. | 257352 | 1172.24 | 1.06 |
| Piramal Pharma Ltd. | 596702 | 1133.08 | 1.03 |
| Ami Organics Ltd. | 50000 | 1084.33 | 0.98 |
| Sanofi India Ltd. | 19164 | 960.41 | 0.87 |
| Mankind Pharma Ltd. | 41446 | 949.36 | 0.86 |
| Sanofi Consumer Healthcare India Ltd. | 19164 | 872.42 | 0.79 |
| Procter & Gamble Health Ltd. | 16000 | 805.45 | 0.73 |
| Glaxosmithkline Pharmaceuticals Ltd. | 24588 | 608.64 | 0.55 |
| Retailing | |||
| Medplus Health Services Ltd. | 118808 | 849.00 | 0.77 |
| Repo | 402.06 | 0.36 | |
| Portfolio Total | 108658.19 | 98.41 | |
| Cash / Net Current Asset | 1740.38 | 1.59 | |
| Net Assets | 110398.57 | 100.00 | |
| Issuer Name | % to NAV |
| Sun Pharmaceutical Industries Ltd. | 11.61 |
| Dr. Reddys Labaratories Ltd. | 7.23 |
| Aurobindo Pharma Ltd. | 7.10 |
| Cipla Ltd. | 6.25 |
| Lupin Laboratories Ltd. | 6.22 |
| Divi Laboratories Ltd. | 5.21 |
| Fortis Healthcare Ltd. | 4.75 |
| Apollo Hospitals Enterprise Ltd. | 3.98 |
| Zydus Lifesciences Ltd. | 3.74 |
| Aster Dm Healthcare Ltd. | 3.31 |
| Total | 59.40 |
| Large Cap | 36.64% |
| Mid Cap | 33.68% |
| Small Cap | 29.68% |
| Market Capitalisation is as per list provided by AMFI. | |