| Tata Infrastructure Fund
(An open ended equity scheme investing in Infrastructure sector.) |
As on 28th February 2025


|
INVESTMENT STYLE:
MINIMUM INVESTMENT/
MULTIPLES FOR NEW INVESTMENT:
MULTIPLES FOR EXISTING INVESTORS:
Please refer to our Tata Mutual Fund website for fundamental changes, wherever applicable
Primarily focuses on equity / equity related instruments of the companies in the Infrastructure sector in India.
INVESTMENT OBJECTIVE:To provide income distribution and / or medium to long term capital gains by investing predominantly in equity / equity related instruments of the companies in the infrastructure sector. The scheme does not assure or guarantee any returns.
DATE OF ALLOTMENT:December 31, 2004
FUND MANAGER(S)Abhinav Sharma (Managing Since 09-Mar-21 and overall experience of 18 years) (Managed in the past from 18-Jun-2018 to 08-Mar-2021 as Lead Fund Manager)
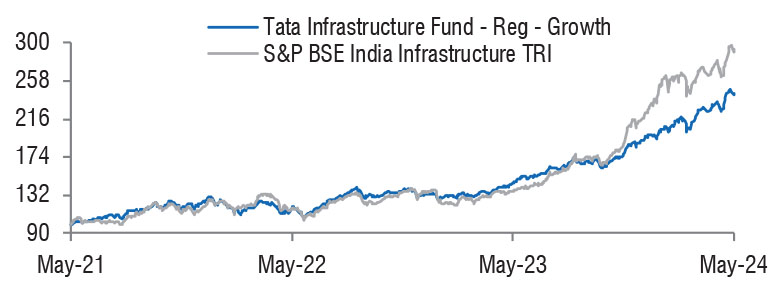
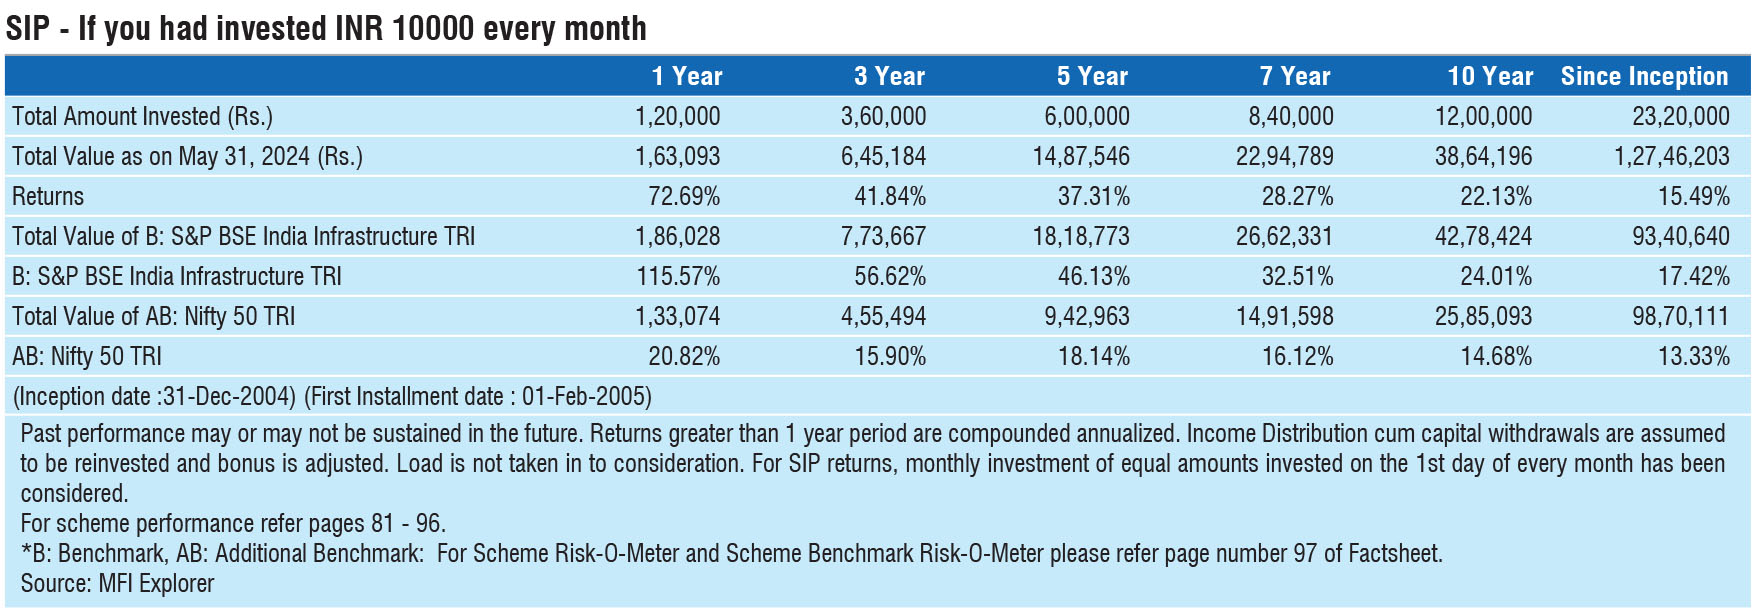
BENCHMARK:BSE India Infrastructure TRI
NAV (in Rs.)| Direct - Growth | : 154.9131 |
| Direct - IDCW | : 81.1719 |
| Reg - Growth | : 143.0826 |
| Reg - IDCW | : 67.8216 |
| FUND SIZE | |
| Rs. 1863.78 (Rs. in Cr.) | |
| MONTHLY AVERAGE AUM | |
| Rs. 1985.61 (Rs. in Cr.) | |
| TURN OVER | |
| Portfolio Turnover (Equity component only) | 20.45% |
| EXPENSE RATIO** | |
| Direct | 1.19 |
| Regular | 2.13 |
| **Note: The rates specified are actual month end expenses charged as on Feb 28, 2025. The above ratio includes the GST on Investment Management Fees. The above ratio excludes, borrowing cost, wherever applicable. | |
| VOLATILITY MEASURES^ | FUND | BENCHMARK |
| Std. Dev (Annualised) | 17.89 | 25.02 |
| Sharpe Ratio | 0.63 | 0.78 |
| Portfolio Beta | 0.58 | NA |
| R Squared | 0.70 | NA |
| Treynor | 1.64 | NA |
| Jenson | 0.00 | NA |
| ^Risk-free rate based on the FBIL Overnight MIBOR rate of
6.4% as on Feb 28, 2025 For calculation methodology | ||
MULTIPLES FOR NEW INVESTMENT:
Rs. 5,000/- and in multiples of Re. 1/- thereafter.
ADDITIONAL INVESTMENT/MULTIPLES FOR EXISTING INVESTORS:
Rs. 1,000/- and multiples of Re. 1/- thereafter.
LOAD STRUCTURE:| ENTRY LOAD | Not Applicable |
| EXIT LOAD | 0.25% of NAV if redeemed/switched out
before 30 days from the date of allotment. |
Please refer to our Tata Mutual Fund website for fundamental changes, wherever applicable
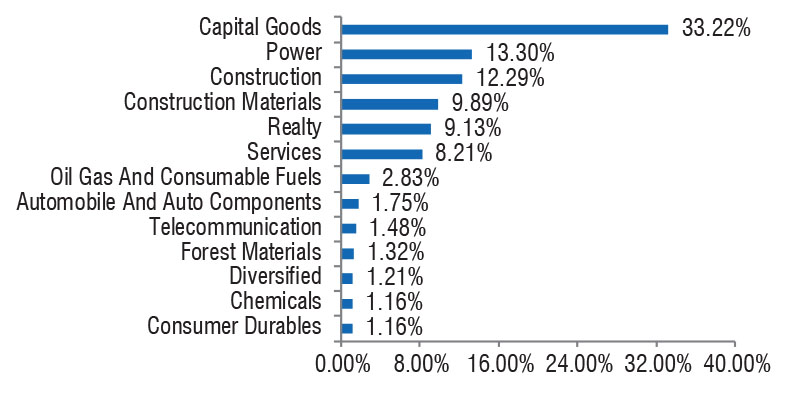
| Company name | No. of Shares | Market Value Rs Lakhs | % of Assets |
| Equity & Equity Related Total | 178642.69 | 95.88 | |
| Aerospace And Defense | |||
| Data Patterns (India) Ltd. | 92970 | 1336.68 | 0.72 |
| Auto Components | |||
| Zf Commercial Vehicle Control Systems India Ltd. | 29700 | 3249.74 | 1.74 |
| Schaeffler Ltd. | 92500 | 2831.66 | 1.52 |
| Kross Ltd. | 816702 | 1359.89 | 0.73 |
| Cement & Cement Products | |||
| The Ramco Cements Ltd. | 696000 | 5769.84 | 3.10 |
| Ultratech Cement Ltd. | 47300 | 4790.76 | 2.57 |
| Ambuja Cements Ltd. | 750000 | 3487.13 | 1.87 |
| Nuvoco Vistas Corporation Ltd. (Nirma Group) | 1093548 | 3427.73 | 1.84 |
| ACC Ltd. | 158000 | 2873.31 | 1.54 |
| Grasim Industries Ltd. | 5262 | 121.38 | 0.07 |
| Chemicals & Petrochemicals | |||
| Linde India Ltd. | 29798 | 1766.14 | 0.95 |
| Construction | |||
| Larsen & Toubro Ltd. | 349889 | 11069.96 | 5.94 |
| G R Infraprojects Ltd. | 377647 | 3796.67 | 2.04 |
| Kec International Ltd. | 445000 | 3054.70 | 1.64 |
| Pnc Infratech Ltd. | 1040462 | 2694.28 | 1.45 |
| Knr Constructions Ltd. | 1123700 | 2476.63 | 1.33 |
| Afcons Infrastructure Ltd. | 497556 | 2055.40 | 1.10 |
| Kalpataru Projects International Ltd. | 208159 | 1830.03 | 0.98 |
| Isgec Heavy Engineering Ltd. | 172687 | 1606.08 | 0.86 |
| Consumer Durables | |||
| Kajaria Ceramics Ltd. | 215535 | 1837.00 | 0.99 |
| Diversified | |||
| 3M India Ltd. | 8170 | 2148.49 | 1.15 |
| Electrical Equipment | |||
| Siemens Ltd. | 78880 | 3647.02 | 1.96 |
| Abb India Ltd. | 61500 | 3035.27 | 1.63 |
| Thermax Ltd. | 90638 | 2944.38 | 1.58 |
| Bharat Heavy Electricals Ltd. | 1575000 | 2821.93 | 1.51 |
| Hitachi Energy India Ltd. | 24048 | 2713.66 | 1.46 |
| Bharat Bijlee Ltd. | 68566 | 1710.58 | 0.92 |
| Waaree Energies Ltd. | 79590 | 1717.99 | 0.92 |
| Voltamp Transformers Ltd. | 24580 | 1543.13 | 0.83 |
| Azad Engineering Ltd. | 118136 | 1504.76 | 0.81 |
| Finance | |||
| Acme Solar Holdings Ltd. | 1048729 | 2025.10 | 1.09 |
| Gas | |||
| Gujarat Gas Ltd. | 124000 | 459.23 | 0.25 |
| Industrial Manufacturing | |||
| Dee Development Engineers Ltd. | 1000000 | 1995.50 | 1.07 |
| Honeywell Automation India Ltd. | 5810 | 1958.07 | 1.05 |
| Cyient Dlm Ltd. | 377384 | 1520.29 | 0.82 |
| Industrial Products | |||
| Cummins India Ltd. | 136168 | 3700.98 | 1.99 |
| Skf India Ltd. | 80000 | 2952.24 | 1.58 |
| Ratnamani Metals & Tubes Ltd. | 115496 | 2839.58 | 1.52 |
| Aia Engineering Ltd. | 87041 | 2734.18 | 1.47 |
| Ksb Ltd. | 427755 | 2639.25 | 1.42 |
| Grindwell Norton Ltd. | 176700 | 2540.68 | 1.36 |
| Astral Ltd. (Erstwhile Astral Poly Technik Ltd.) | 186700 | 2496.65 | 1.34 |
| Timken India Ltd. | 80323 | 1987.35 | 1.07 |
| Inox India Ltd. | 207156 | 1986.63 | 1.07 |
| Bansal Wire Industries Ltd. | 468988 | 1583.30 | 0.85 |
| Paper, Forest & Jute Products | |||
| Aditya Birla Real Estate Ltd. | 126900 | 2364.27 | 1.27 |
| Petroleum Products | |||
| Hindustan Petroleum Corporation Ltd. | 667500 | 1960.78 | 1.05 |
| Power | |||
| NTPC Ltd. | 2325000 | 7241.21 | 3.89 |
| Torrent Power Ltd. | 320000 | 4041.44 | 2.17 |
| Adani Energy Solutions Ltd. | 522143 | 3398.63 | 1.82 |
| Power Grid Corporation Of India Ltd. | 1293333 | 3244.33 | 1.74 |
| Adani Power Ltd. | 600000 | 2873.70 | 1.54 |
| Tata Power Company Ltd. | 775000 | 2628.80 | 1.41 |
| Cesc Ltd. | 1600000 | 2092.64 | 1.12 |
| Realty | |||
| Dlf Ltd. | 640000 | 4067.52 | 2.18 |
| The Phoenix Mills Ltd. | 182000 | 2817.54 | 1.51 |
| Oberoi Realty Ltd. | 167000 | 2479.12 | 1.33 |
| Sobha Ltd. | 183832 | 2207.09 | 1.18 |
| Brookfield India Real Estate Trust | 575247 | 1720.97 | 0.92 |
| Tarc Ltd. | 1409174 | 1679.03 | 0.90 |
| Telecom - Services | |||
| Indus Towers Ltd. | 903458 | 2921.33 | 1.57 |
| Transport Infrastructure | |||
| Adani Ports And Special Economic Zone Ltd. | 460000 | 4919.24 | 2.64 |
| Gujarat Pipavav Port Ltd. | 1724690 | 2155.00 | 1.16 |
| Transport Services | |||
| Tci Express Ltd. | 310658 | 2108.90 | 1.13 |
| Spicejet Ltd. | 4058441 | 1863.23 | 1.00 |
| Mahindra Logistics Ltd. | 490000 | 1216.67 | 0.65 |
| Repo | 3415.24 | 1.83 | |
| Portfolio Total | 182057.93 | 97.71 | |
| Cash / Net Current Asset | 4320.34 | 2.29 | |
| Net Assets | 186378.27 | 100.00 | |
| Issuer Name | % to NAV |
| Larsen & Toubro Ltd. | 5.94 |
| NTPC Ltd. | 3.89 |
| The Ramco Cements Ltd. | 3.10 |
| Adani Ports & Special Economic Zone Ltd. | 2.64 |
| Ultratech Cement Ltd. | 2.57 |
| Dlf Ltd. | 2.18 |
| Torrent Power Ltd. | 2.17 |
| G R Infraprojects Ltd. | 2.04 |
| Cummins India Ltd. | 1.99 |
| Siemens India Ltd. | 1.96 |
| Total | 28.48 |
| Large Cap | 34.56% |
| Mid Cap | 21.91% |
| Small Cap | 43.53% |
| Market Capitalisation is as per list provided by AMFI. | |