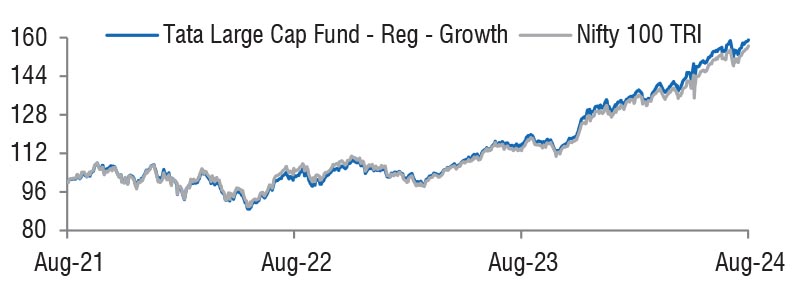
| Tata Large Cap Fund
(An open-ended equity scheme predominantly investing in large cap stocks.) |
As on 28th February 2025


|
Primarily invests in equity and equity related instruments of large market cap companies.
INVESTMENT OBJECTIVE:To provide income distribution and / or medium to long term capital gains while at all times emphasising the importance of capital appreciation. However, there is no assurance or guarantee that the investment objective of the Scheme will be achieved. The scheme does not assure or guarantee any returns.
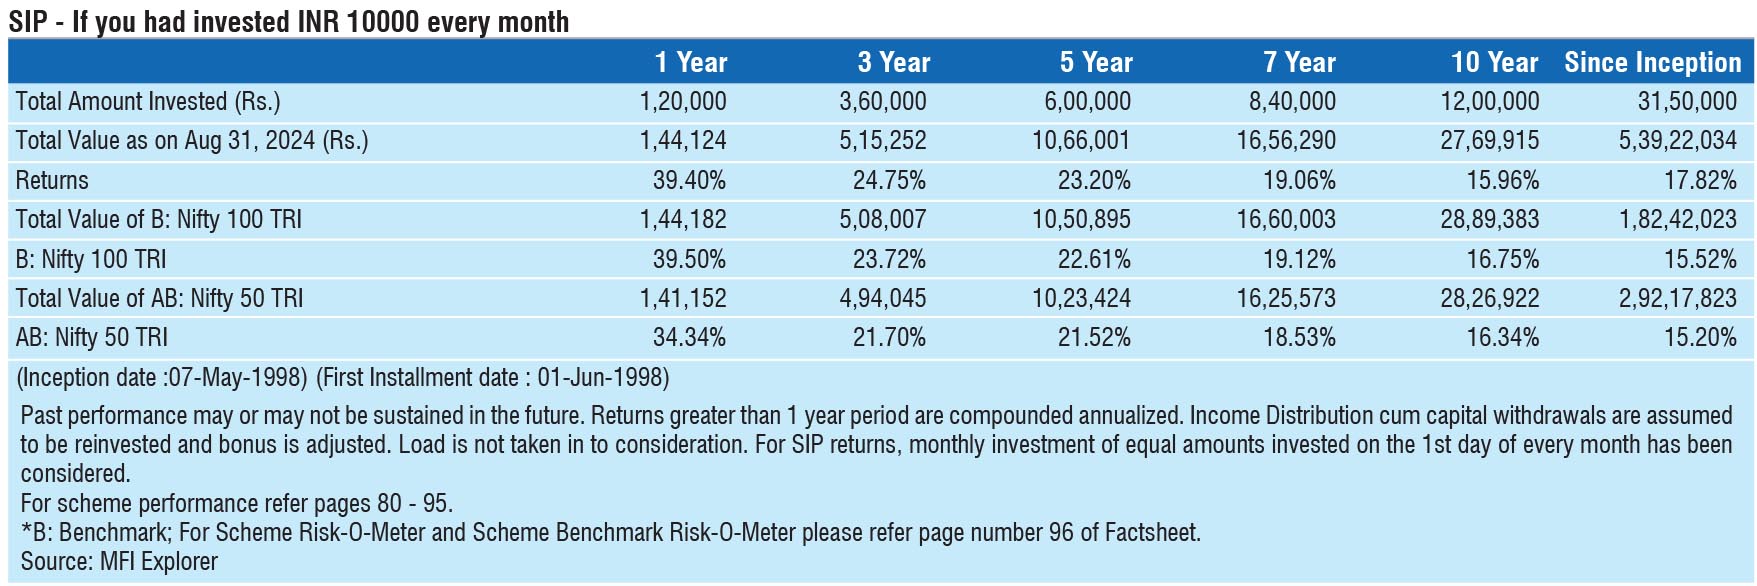
DATE OF ALLOTMENT:May 7, 1998
FUND MANAGER(S)Abhinav Sharma (Managing Since 05-Apr-23 and overall experience of 18 years), Kapil Malhotra (Managing Since 19-Dec-23 and overall experience of 15 years)
BENCHMARK:Nifty 100 TRI
NAV (in Rs.)| Direct - Growth | : 505.7365 |
| Direct - IDCW | : 114.8983 |
| Reg - Growth | : 442.4253 |
| Reg - IDCW | : 96.4005 |
| FUND SIZE | |
| Rs. 2267.20 (Rs. in Cr.) | |
| MONTHLY AVERAGE AUM | |
| Rs. 2369.19 (Rs. in Cr.) | |
| TURN OVER | |
| Portfolio Turnover (Equity component only) | 35.17% |
| EXPENSE RATIO** | |
| Direct | 1.06 |
| Regular | 2.07 |
| **Note: The rates specified are actual month end expenses charged as on Feb 28, 2025. The above ratio includes the Service tax on Investment Management Fees. The above ratio excludes, borrowing cost, wherever applicable. | |
| VOLATILITY MEASURES^ | FUND | BENCHMARK |
| Std. Dev (Annualised) | 13.58 | 13.91 |
| Sharpe Ratio | 0.40 | 0.36 |
| Portfolio Beta | 0.94 | NA |
| R Squared | 0.98 | NA |
| Treynor | 0.50 | NA |
| Jenson | 0.07 | NA |
| ^Risk-free rate based on the FBIL Overnight MIBOR rate of 6.4% as
on Feb 28, 2025 For calculation methodology | ||
MULTIPLES FOR NEW INVESTMENT:
Rs. 5,000/- and in multiples of Re. 1/- thereafter.
ADDITIONAL INVESTMENT/MULTIPLES FOR EXISTING INVESTORS:
Rs. 1,000/- and multiples of Re. 1/- thereafter.
LOAD STRUCTURE:| ENTRY LOAD | Not Applicable |
| EXIT LOAD |
1) On or before expiry of 365 days from the date of
allotment: If the withdrawal amount or switched out
amount is not more than 12% of the original cost of
investment: NIL 2) On or before expiry of 365 days from the date of allotment: If the withdrawal amount or switched out amount is more than 12% of the original cost of investment: 1% 3) Redemption after expiry of 365 days from the date of allotment: NIL (w.e.f 5th November, 2018) |
Please refer to our Tata Mutual Fund website for fundamental changes, wherever applicable
| Company name | No. of Shares | Market Value Rs Lakhs | % of Assets |
| Equity & Equity Related Total | 216106.51 | 95.32 | |
| Agricultural Food & Other Products | |||
| Marico Ltd. | 650000 | 3903.90 | 1.72 |
| Automobiles | |||
| Mahindra & Mahindra Ltd. | 292000 | 7548.49 | 3.33 |
| Hyundai Motor India Ltd. | 212548 | 3676.87 | 1.62 |
| Hero Motocorp Ltd. | 59865 | 2203.69 | 0.97 |
| Banks | |||
| HDFC Bank Ltd. | 1285950 | 22277.80 | 9.83 |
| Kotak Mahindra Bank Ltd. | 649000 | 12350.15 | 5.45 |
| ICICI Bank Ltd. | 865300 | 10419.08 | 4.60 |
| Axis Bank Ltd. | 920000 | 9343.06 | 4.12 |
| State Bank Of India | 821000 | 5655.05 | 2.49 |
| Karur Vysya Bank Ltd. | 1200000 | 2413.32 | 1.06 |
| Indusind Bank Ltd. | 67771 | 671.00 | 0.30 |
| Cement & Cement Products | |||
| Shree Cement Ltd. | 11989 | 3271.08 | 1.44 |
| Ambuja Cements Ltd. | 597765 | 2779.31 | 1.23 |
| Grasim Industries Ltd. | 4223 | 97.41 | 0.04 |
| Construction | |||
| Larsen & Toubro Ltd. | 270784 | 8567.20 | 3.78 |
| Consumer Durables | |||
| Havells India Ltd. | 185084 | 2631.52 | 1.16 |
| Berger Paints India Ltd. | 399666 | 1952.57 | 0.86 |
| Kajaria Ceramics Ltd. | 164765 | 1404.29 | 0.62 |
| Diversified Fmcg | |||
| Hindustan Unilever Ltd. | 220000 | 4818.55 | 2.13 |
| Electrical Equipment | |||
| Siemens Ltd. | 52081 | 2407.97 | 1.06 |
| Bharat Heavy Electricals Ltd. | 1000000 | 1791.70 | 0.79 |
| Ferrous Metals | |||
| Jsw Steel Ltd. | 430000 | 4088.01 | 1.80 |
| Finance | |||
| Bajaj Finance Ltd. | 55000 | 4691.67 | 2.07 |
| Power Finance Corporation Ltd. | 613750 | 2235.89 | 0.99 |
| Muthoot Finance Ltd. | 105000 | 2239.44 | 0.99 |
| Gas | |||
| Gail ( India ) Ltd. | 1500000 | 2340.60 | 1.03 |
| It - Services | |||
| Cyient Ltd. | 160000 | 2027.44 | 0.89 |
| It - Software | |||
| Infosys Ltd. | 558000 | 9417.37 | 4.15 |
| Tata Consultancy Services Ltd. | 121873 | 4245.14 | 1.87 |
| Wipro Ltd. | 1500000 | 4164.75 | 1.84 |
| Tech Mahindra Ltd. | 200000 | 2975.70 | 1.31 |
| Industrial Manufacturing | |||
| Honeywell Automation India Ltd. | 4500 | 1516.57 | 0.67 |
| Insurance | |||
| HDFC Life Insurance Co. Ltd. | 750000 | 4563.75 | 2.01 |
| ICICI Lombard General Insurance Co. Ltd. | 100000 | 1690.95 | 0.75 |
| Leisure Services | |||
| Westlife Foodworld Ltd. | 234489 | 1601.68 | 0.71 |
| Personal Products | |||
| Dabur India Ltd. | 520000 | 2565.16 | 1.13 |
| Colgate-Palmolive India Ltd. | 80000 | 1971.68 | 0.87 |
| Petroleum Products | |||
| Reliance Industries Ltd. | 900000 | 10800.90 | 4.76 |
| Bharat Petroleum Corporation Ltd. | 500000 | 1186.50 | 0.52 |
| Pharmaceuticals & Biotechnology | |||
| Sun Pharmaceutical Industries Ltd. | 365000 | 5815.36 | 2.56 |
| Divi Laboratories Ltd. | 70000 | 3836.18 | 1.69 |
| Dr Reddys Laboratories Ltd. | 300000 | 3349.50 | 1.48 |
| Granules India Ltd. | 533136 | 2462.02 | 1.09 |
| Power | |||
| NTPC Ltd. | 1505000 | 4687.32 | 2.07 |
| Power Grid Corporation Of India Ltd. | 1333333 | 3344.67 | 1.48 |
| Adani Energy Solutions Ltd. | 458193 | 2982.38 | 1.32 |
| Realty | |||
| Dlf Ltd. | 300000 | 1906.65 | 0.84 |
| Retailing | |||
| Swiggy Ltd. | 646000 | 2161.84 | 0.95 |
| Telecom - Services | |||
| Bharti Airtel Ltd. | 325000 | 5103.15 | 2.25 |
| Indus Towers Ltd. | 476042 | 1539.28 | 0.68 |
| Transport Infrastructure | |||
| Adani Ports And Special Economic Zone Ltd. | 245000 | 2620.03 | 1.16 |
| Transport Services | |||
| Interglobe Aviation Ltd. | 40000 | 1790.92 | 0.79 |
| Repo | 8047.57 | 3.55 | |
| Portfolio Total | 224154.08 | 98.87 | |
| Cash / Net Current Asset | 2565.87 | 1.13 | |
| Net Assets | 226719.95 | 100.00 | |
| Issuer Name | % to NAV |
| HDFC Bank Ltd. | 9.83 |
| Kotak Mahindra Bank | 5.45 |
| Reliance Industries Ltd. | 4.76 |
| ICICI Bank Ltd. | 4.60 |
| Infosys Ltd. | 4.15 |
| Axis Bank Ltd. | 4.12 |
| Larsen & Toubro Ltd. | 3.78 |
| Mahindra & Mahindra Ltd. | 3.33 |
| Sun Pharmaceutical Industries Ltd. | 2.56 |
| State Bank Of India | 2.49 |
| Total | 45.07 |
| Large Cap | 86.62% |
| Mid Cap | 8.80% |
| Small Cap | 4.59% |
| Market Capitalisation is as per list provided by AMFI. | |