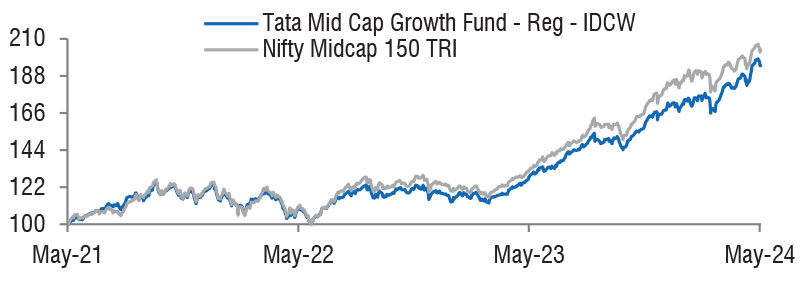
| Tata Mid Cap Growth Fund
(An open-ended equity scheme predominantly investing in mid cap stocks.) |
As on 28th February 2025


|
INVESTMENT STYLE:
MINIMUM INVESTMENT/
MULTIPLES FOR NEW INVESTMENT:
MULTIPLES FOR EXISTING INVESTORS:
Please refer to our Tata Mutual Fund website for fundamental changes, wherever applicable
An equity scheme with focus towards mid cap stocks.
INVESTMENT OBJECTIVE:To provide income distribution and / or medium to long term capital gains. Investments would be focused towards mid-cap stocks. However, there is no assurance or guarantee that the investment objective of the Scheme will be achieved. The scheme does not assure or guarantee any returns.
DATE OF ALLOTMENT:July 1, 1994
FUND MANAGER(S)Satish Chandra Mishra (Managing Since 09-Mar-21 and overall experience of 18 years )
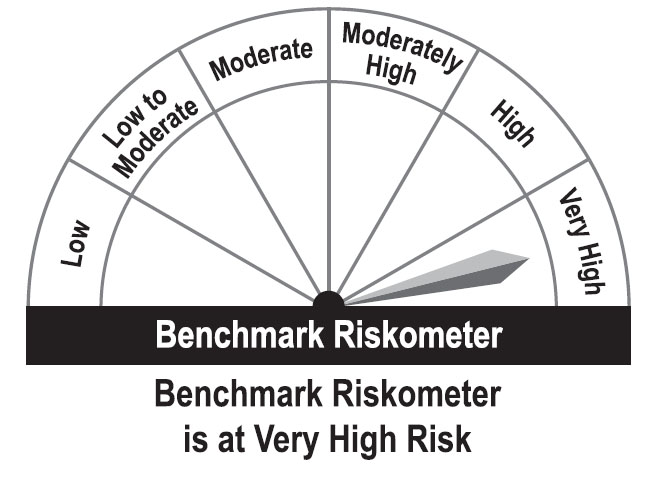
BENCHMARK:Nifty Midcap 150 TRI
NAV (in Rs.)| Direct - Growth | : 408.1124 |
| Direct - IDCW | : 134.7144 |
| Reg - Growth | : 360.7094 |
| Reg - IDCW | : 99.5617 |
| FUND SIZE | |
| Rs. 3954.92 (Rs. in Cr.) | |
| MONTHLY AVERAGE AUM | |
| Rs. 4176.21 (Rs. in Cr.) | |
| TURN OVER | |
| Portfolio Turnover (Equity component only) | 28.67% |
| EXPENSE RATIO** | |
| Direct | 0.69 |
| Regular | 1.90 |
| **Note: The rates specified are actual month end expenses charged as on Feb 28, 2025. The above ratio includes the GST on Investment Management Fees. The above ratio excludes, borrowing cost, wherever applicable. | |
| VOLATILITY MEASURES^ | FUND | BENCHMARK |
| Std. Dev (Annualised) | 15.70 | 17.02 |
| Sharpe Ratio | 0.62 | 0.76 |
| Portfolio Beta | 0.88 | NA |
| R Squared | 0.96 | NA |
| Treynor | 0.93 | NA |
| Jenson | -0.13 | NA |
| ^Risk-free rate based on the FBIL Overnight MIBOR rate of 6.4% as
on Feb 28, 2025 For calculation methodology | ||
MULTIPLES FOR NEW INVESTMENT:
Rs. 5,000/- and in multiples of Re. 1/- thereafter.
ADDITIONAL INVESTMENT/MULTIPLES FOR EXISTING INVESTORS:
Rs. 1,000/- and multiples of Re. 1/- thereafter.
LOAD STRUCTURE:| ENTRY LOAD | Not Applicable |
| EXIT LOAD |
1) On or :b efore expiry of 365 days from the date of
allotment: If the withdrawal amount or switched out
amount is not more than 12% of the original cost of
investment: NIL 2) On or before expiry of 365 days from the date of allotment: If the withdrawal amount or switched out amount is more than 12% of the original cost of investment: 1% 3) Redemption after expiry of 365 days from the date of allotment: NIL (w.e.f 5th November, 2018) |
Please refer to our Tata Mutual Fund website for fundamental changes, wherever applicable
| Company Name | No. of Shares | Market Value Rs Lakhs | % of assets |
| Equity & Equity Related Total | 380635.17 | 96.24 | |
| Aerospace And Defense | |||
| Bharat Electronics Ltd. | 1600000 | 3940.00 | 1.00 |
| Agricultural Food & Other Products | |||
| Patanjali Foods Ltd. | 270000 | 4753.49 | 1.20 |
| Agricultural, Commercial & Construction Vehicles | |||
| Ashok Leyland Ltd. | 2975000 | 6334.97 | 1.60 |
| Auto Components | |||
| Uno Minda Ltd. | 1001126 | 8268.30 | 2.09 |
| Zf Commercial Vehicle Control Systems India Ltd. | 56551 | 6187.75 | 1.56 |
| Balkrishna Industries Ltd. | 173000 | 4525.07 | 1.14 |
| Bosch Ltd. | 14790 | 3925.86 | 0.99 |
| Banks | |||
| Federal Bank Ltd. | 4500000 | 7992.90 | 2.02 |
| Au Small Finance Bank Ltd. | 1400000 | 7919.80 | 2.00 |
| Indian Bank | 1100000 | 5618.80 | 1.42 |
| IDFC First Bank Ltd. | 9000000 | 5255.10 | 1.33 |
| Cement & Cement Products | |||
| The Ramco Cements Ltd. | 700000 | 5803.00 | 1.47 |
| J K Cement Ltd. | 110000 | 4828.29 | 1.22 |
| ACC Ltd. | 207834 | 3779.57 | 0.96 |
| Chemicals & Petrochemicals | |||
| Navin Fluorine International Ltd. | 135901 | 5112.94 | 1.29 |
| Linde India Ltd. | 40000 | 2370.82 | 0.60 |
| Commercial Services & Supplies | |||
| Teamlease Services Ltd. | 262341 | 5113.03 | 1.29 |
| Construction | |||
| Kec International Ltd. | 614000 | 4214.80 | 1.07 |
| G R Infraprojects Ltd. | 380400 | 3824.35 | 0.97 |
| Consumer Durables | |||
| Kajaria Ceramics Ltd. | 750000 | 6392.25 | 1.62 |
| Voltas Ltd. | 300000 | 3960.30 | 1.00 |
| Diversified | |||
| 3M India Ltd. | 10000 | 2629.73 | 0.66 |
| Electrical Equipment | |||
| Thermax Ltd. | 191737 | 6228.58 | 1.57 |
| Bharat Heavy Electricals Ltd. | 1500000 | 2687.55 | 0.68 |
| Waaree Energies Ltd. | 64580 | 1393.99 | 0.35 |
| Fertilizers & Agrochemicals | |||
| Pi Industries Ltd. | 250000 | 7534.88 | 1.91 |
| Upl Ltd. | 800000 | 5063.60 | 1.28 |
| Upl Ltd. - (Partly Paidup) Right Entitlements - 26-11-2024 | 100000 | 353.20 | 0.09 |
| Finance | |||
| Muthoot Finance Ltd. | 561497 | 11975.61 | 3.03 |
| LIC Housing Finance Ltd. | 1200000 | 5962.80 | 1.51 |
| Aavas Financiers Ltd. | 348000 | 5865.71 | 1.48 |
| Power Finance Corporation Ltd. | 1250000 | 4553.75 | 1.15 |
| L&T Finance Ltd. | 3291958 | 4435.26 | 1.12 |
| Gas | |||
| Indraprastha Gas Ltd. | 4500000 | 8526.60 | 2.16 |
| Healthcare Services | |||
| Max Healthcare Institute Ltd. | 700000 | 6846.70 | 1.73 |
| It - Software | |||
| Mphasis Ltd. | 353648 | 7947.35 | 2.01 |
| Persistent Systems Ltd. | 120000 | 6364.68 | 1.61 |
| Sonata Software Ltd. | 1100000 | 3971.00 | 1.00 |
| Industrial Products | |||
| Cummins India Ltd. | 369694 | 10048.10 | 2.54 |
| Aia Engineering Ltd. | 190000 | 5968.38 | 1.51 |
| Astral Ltd. (Erstwhile Astral Poly Technik Ltd.) | 300000 | 4011.75 | 1.01 |
| Apl Apollo Tubes Ltd. | 230000 | 3309.59 | 0.84 |
| Carborundum Universal Ltd. | 300000 | 2494.95 | 0.63 |
| Skf India Ltd. | 57710 | 2129.67 | 0.54 |
| Insurance | |||
| Max Financial Services Ltd. | 1300000 | 12975.30 | 3.28 |
| ICICI Lombard General Insurance Co. Ltd. | 600000 | 10145.70 | 2.57 |
| Leisure Services | |||
| Jubilant Foodworks Ltd. | 1800000 | 11269.80 | 2.85 |
| Indian Railway Catering And Tourism Corporation Ltd. | 550000 | 3690.23 | 0.93 |
| Petroleum Products | |||
| Hindustan Petroleum Corporation Ltd. | 1800000 | 5287.50 | 1.34 |
| Pharmaceuticals & Biotechnology | |||
| Alkem Laboratories Ltd. | 250000 | 11615.50 | 2.94 |
| Lupin Ltd. | 600000 | 11427.90 | 2.89 |
| Aurobindo Pharma Ltd. | 1000000 | 10583.00 | 2.68 |
| Biocon Ltd. | 1567612 | 4741.24 | 1.20 |
| Granules India Ltd. | 1000767 | 4621.54 | 1.17 |
| Gland Pharma Ltd. | 264000 | 4099.39 | 1.04 |
| Piramal Pharma Ltd. | 2000000 | 3797.80 | 0.96 |
| Power | |||
| Torrent Power Ltd. | 200000 | 2525.90 | 0.64 |
| Realty | |||
| Oberoi Realty Ltd. | 500000 | 7422.50 | 1.88 |
| The Phoenix Mills Ltd. | 300000 | 4644.30 | 1.17 |
| Brigade Enterprises Ltd. | 326813 | 3095.08 | 0.78 |
| Sobha Ltd. | 244873 | 2939.95 | 0.74 |
| Telecom - Services | |||
| Bharti Hexacom Ltd. | 564114 | 7358.30 | 1.86 |
| Indus Towers Ltd. | 1537298 | 4970.85 | 1.26 |
| Textiles & Apparels | |||
| Page Industries Ltd. | 10000 | 4051.60 | 1.02 |
| K.P.R. Mill Ltd. | 479100 | 3840.47 | 0.97 |
| Transport Infrastructure | |||
| Jsw Infrastructure Ltd. | 3100000 | 7897.25 | 2.00 |
| Adani Ports And Special Economic Zone Ltd. | 500000 | 5347.00 | 1.35 |
| Transport Services | |||
| Mahindra Logistics Ltd. | 750000 | 1862.25 | 0.47 |
| Repo | 5348.94 | 1.35 | |
| Portfolio Total | 385984.11 | 97.59 | |
| Cash / Net Current Asset | 9507.62 | 2.41 | |
| Net Assets | 395491.73 | 100.00 | |
| Issuer Name | % to NAV |
| Max Financial Services Ltd. | 3.28 |
| Muthoot Finance Ltd. | 3.03 |
| Alkem Laboratories Ltd. | 2.94 |
| Lupin Laboratories Ltd. | 2.89 |
| Jubilant Foodworks Ltd. | 2.85 |
| Aurobindo Pharma Ltd. | 2.68 |
| ICICI Lombard General Insurance Co. Ltd. | 2.57 |
| Cummins India Ltd. | 2.54 |
| Indraprastha Gas Ltd. | 2.16 |
| Uno Minda Ltd. | 2.09 |
| Total | 27.03 |
| Large Cap | 8.61% |
| Mid Cap | 71.59% |
| Small Cap | 19.80% |
| Market Capitalisation is as per list provided by AMFI. | |