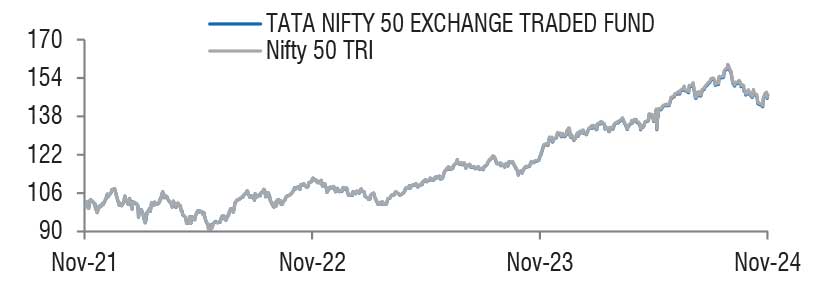
| Tata Nifty 50 Exchange Traded Fund
(An open ended Exchange Traded Fund tracking Nifty 50 Index.) |
As on 28th February 2025


|
Exchange Traded Fund tracking Nifty 50 Index.
INVESTMENT OBJECTIVE:The investment objective of the scheme is to provide returns that is closely correspond to the total returns of the securities as represented by the Nifty 50 index, subject to tracking error. However, there is no assurance or guarantee that the investment objective of the Scheme will be achieved.
DATE OF ALLOTMENT:January 01, 2019
FUND MANAGER(S)Kapil Menon (Managing Since 26-Apr-24 and overall experience of 21 years)
ASSISTANT FUND MANAGER:Rakesh Indrajeet Prajapati (Managing Since 20-Dec-24 and overall experience of 19 years)
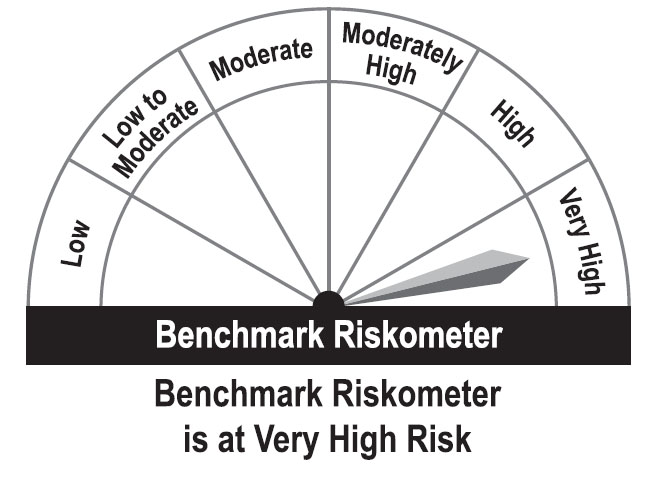
BENCHMARK:Nifty 50 TRI
NAV (in Rs.)| Direct - Growth | : 236.7986 |
| FUND SIZE | |
| Rs. 632.68 (Rs. in Cr.) | |
| MONTHLY AVERAGE AUM | |
| Rs. 659.34 (Rs. in Cr.) | |
| TURN OVER | |
| Portfolio Turnover (Equity component only) | 9.14% |
| EXPENSE RATIO** | |
| Direct | 0.08 |
| Regular | 0.00 |
| **Note: The rates specified are actual month end expenses charged as on Feb 28, 2025. The above ratio includes the GST on Investment Management Fees. The above ratio excludes, borrowing cost, wherever applicable. | |
| VOLATILITY MEASURES^ | FUND | BENCHMARK |
| Std. Dev (Annualised) | 13.09 | 13.14 |
| Sharpe Ratio | 0.36 | 0.37 |
| Portfolio Beta | 0.97 | NA |
| R Squared | 1.00 | NA |
| Treynor | 0.42 | NA |
| Jenson | 0.00 | NA |
| ^Risk-free rate based on the FBIL Overnight
MIBOR rate of 6.4% as on Feb 28, 2025 For calculation methodology | ||
MULTIPLES FOR NEW INVESTMENT:
Transactions by Market Makers: in creation unit
size (refer SID for creation unit size)
Transactions by Investors:
• Amount greater than 25 Crs: Directly
through AMC or through exchange
• Amount less than 25 Crs: Through
exchange, min 1 unit and in multiple thereof
MULTIPLES FOR EXISTING INVESTORS:
Transactions by Market Makers: in creation unit
size (refer SID for creation unit size)
Transactions by Investors:
• Amount greater than 25 Crs: Directly
through AMC or through exchange
• Amount less than 25 Crs: Through
exchange, min 1 unit and in multiple thereof
| ENTRY LOAD | Not Applicable |
| EXIT LOAD | Nil |
Please refer to our Tata Mutual Fund website for fundamental changes, wherever applicable
| Company Name | No. of Shares | Market Value Rs Lakhs | % of assets |
| Equity & Equity Related Total | 63206.16 | 99.90 | |
| Aerospace And Defense | |||
| Bharat Electronics Ltd. | 227942 | 561.31 | 0.89 |
| Agricultural Food & Other Products | |||
| Tata Consumer Products Ltd. | 41456 | 399.51 | 0.63 |
| Automobiles | |||
| Mahindra & Mahindra Ltd. | 56428 | 1458.72 | 2.31 |
| Maruti Suzuki India Ltd. | 8386 | 1001.78 | 1.58 |
| Tata Motors Ltd. | 133600 | 829.19 | 1.31 |
| Bajaj Auto Ltd. | 7072 | 558.89 | 0.88 |
| Eicher Motors Ltd. | 8768 | 418.55 | 0.66 |
| Hero Motocorp Ltd. | 8261 | 304.10 | 0.48 |
| Banks | |||
| HDFC Bank Ltd. | 484660 | 8396.25 | 13.27 |
| ICICI Bank Ltd. | 449717 | 5415.04 | 8.56 |
| Axis Bank Ltd. | 181763 | 1845.89 | 2.92 |
| Kotak Mahindra Bank Ltd. | 93589 | 1780.95 | 2.81 |
| State Bank Of India | 245275 | 1689.45 | 2.67 |
| Indusind Bank Ltd. | 42096 | 416.79 | 0.66 |
| Cement & Cement Products | |||
| Ultratech Cement Ltd. | 7268 | 736.14 | 1.16 |
| Grasim Industries Ltd. | 23682 | 546.26 | 0.86 |
| Construction | |||
| Larsen & Toubro Ltd. | 75030 | 2373.84 | 3.75 |
| Consumable Fuels | |||
| Coal India Ltd. | 144558 | 533.92 | 0.84 |
| Consumer Durables | |||
| Titan Company Ltd. | 26370 | 811.47 | 1.28 |
| Asian Paints (India) Ltd. | 28824 | 628.29 | 0.99 |
| Diversified Fmcg | |||
| ITC Ltd. | 592571 | 2340.66 | 3.70 |
| Hindustan Unilever Ltd. | 56581 | 1239.27 | 1.96 |
| Ferrous Metals | |||
| Tata Steel Ltd. | 528116 | 724.58 | 1.15 |
| Jsw Steel Ltd. | 61163 | 581.48 | 0.92 |
| Finance | |||
| Bajaj Finance Ltd. | 17838 | 1521.63 | 2.41 |
| Bajaj Finserv Ltd. | 34856 | 652.61 | 1.03 |
| Shriram Finance Ltd. | 89077 | 549.87 | 0.87 |
| Food Products | |||
| Nestle India Ltd. | 22825 | 499.79 | 0.79 |
| Britannia Industries Ltd. | 7510 | 345.12 | 0.55 |
| Healthcare Services | |||
| Apollo Hospitals Enterprise Ltd. | 6451 | 390.45 | 0.62 |
| It - Software | |||
| Infosys Ltd. | 229582 | 3874.66 | 6.12 |
| Tata Consultancy Services Ltd. | 65134 | 2268.78 | 3.59 |
| HCL Technologies Ltd. | 67469 | 1062.67 | 1.68 |
| Tech Mahindra Ltd. | 40458 | 601.95 | 0.95 |
| Wipro Ltd. | 180474 | 501.09 | 0.79 |
| Insurance | |||
| HDFC Life Insurance Co. Ltd. | 68123 | 414.53 | 0.66 |
| Sbi Life Insurance Company Ltd. | 28520 | 407.98 | 0.64 |
| Metals & Minerals Trading | |||
| Adani Enterprises Ltd. | 15867 | 332.57 | 0.53 |
| Non - Ferrous Metals | |||
| Hindalco Industries Ltd. | 92649 | 587.72 | 0.93 |
| Oil | |||
| Oil & Natural Gas Co. | 247214 | 556.85 | 0.88 |
| Petroleum Products | |||
| Reliance Industries Ltd. | 432666 | 5192.42 | 8.21 |
| Bharat Petroleum Corporation Ltd. | 123357 | 292.73 | 0.46 |
| Pharmaceuticals & Biotechnology | |||
| Sun Pharmaceutical Industries Ltd. | 68798 | 1096.12 | 1.73 |
| Cipla Ltd. | 35033 | 493.09 | 0.78 |
| Dr Reddys Laboratories Ltd. | 38872 | 434.01 | 0.69 |
| Power | |||
| NTPC Ltd. | 301789 | 939.92 | 1.49 |
| Power Grid Corporation Of India Ltd. | 288710 | 724.23 | 1.14 |
| Retailing | |||
| Trent Ltd. | 14152 | 686.59 | 1.09 |
| Telecom - Services | |||
| Bharti Airtel Ltd. | 170939 | 2684.08 | 4.24 |
| Transport Infrastructure | |||
| Adani Ports And Special Economic Zone Ltd. | 46977 | 502.37 | 0.79 |
| Repo | 14.70 | 0.02 | |
| Portfolio Total | 63220.86 | 99.92 | |
| Cash / Net Current Asset | 47.35 | 0.08 | |
| Net Assets | 63268.21 | 100.00 | |
| Note: As per the guidance issued by AMFI vide correspondence 35P/MEM-COR/57/2019-20,any realization of proceeds from the locked-in shares of Yes Bank Ltd. (which is 3 years from the commencement of the Revival scheme i.e March 13,2020) shall be distributed (post conclusion of the lock in period) among the set of investors existing in the unit holders’ register / BENPOS as on end of March 13, 2020.For further details refer our website https://www.tatamutualfund.com/docs/default-source/statutory-disclosures/valuation-c urrent-update/valuation-update-17-03-2020.pdf?sfvrsn=aa8cd899_2 | |||
| Issuer Name | % to NAV |
| HDFC Bank Ltd. | 13.27 |
| ICICI Bank Ltd. | 8.56 |
| Reliance Industries Ltd. | 8.21 |
| Infosys Ltd. | 6.12 |
| Bharti Airtel Ltd. | 4.24 |
| Larsen & Toubro Ltd. | 3.75 |
| ITC Ltd. | 3.70 |
| Tata Consultancy Services Ltd. | 3.59 |
| Axis Bank Ltd. | 2.92 |
| Kotak Mahindra Bank | 2.81 |
| Total | 57.17 |
| Large Cap | 98.72% |
| Mid Cap | 1.28% |
| Small Cap | 0.00% |
| Market Capitalisation is as per list provided by AMFI. | |