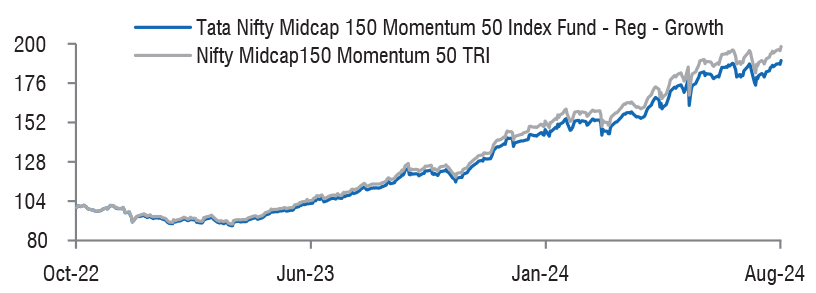
| Tata Nifty Midcap 150 Momentum 50 Index Fund
(An open-ended scheme replicating/tracking NIFTY Midcap 150 Momentum 50 Index) |
As on 28th February 2025


|
The Fund seeks to replicate Nifty Midcap 150 Momentum 50 Index. The index selects the top 50 stocks based on their momentum score out of a universe of 150 midcap stocks.
INVESTMENT OBJECTIVE:The investment objective of the scheme is to provide
returns, before expenses, that commensurate with the
performance of NIFTY Midcap 150 Momentum 50 Index
(TRI), subject to tracking error.
There is no assurance or guarantee that the investment
objective of the scheme will be achieved. The scheme
does not assure or guarantee any returns.
October 20,2022
FUND MANAGER(S)Kapil Menon (Managing Since 26-Apr-24 and overall experience of 21 years)
ASSISTANT FUND MANAGER:Rakesh Indrajeet Prajapati (Managing Since 20-Dec-24 and overall experience of 19 years)
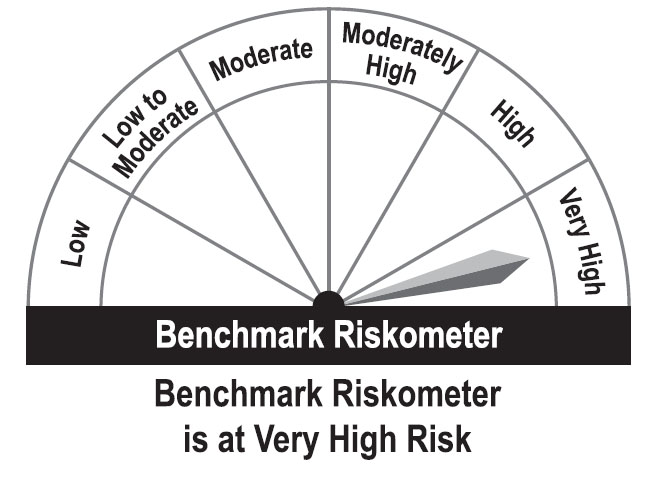
BENCHMARK:Nifty Midcap150 Momentum 50 TRI
NAV (in Rs.)| Direct - Growth | : 15.0079 |
| Direct - IDCW | : 15.0079 |
| Reg - Growth | : 14.7355 |
| Reg - IDCW | : 14.7355 |
| FUND SIZE | |
| Rs. 654.04 (Rs. in Cr.) | |
| MONTHLY AVERAGE AUM | |
| Rs. 687.04 (Rs. in Cr.) | |
| TURN OVER | |
| Portfolio Turnover (Equity component only) | 130.14% |
| EXPENSE RATIO** | |
| Direct | 0.40 |
| Regular | 1.02 |
| ^Risk-free rate based on the FBIL Overnight MIBOR rate
of 6.4% as on Feb 28, 2025 For calculation methodology **Note: The rates specified are actual month end expenses charged as on Feb 28, 2025. The above ratio includes the Service tax on Investment Management Fees. The above ratio excludes, borrowing cost, wherever applicable. | |
MULTIPLES FOR NEW INVESTMENT:
Rs.5,000/- and in multiple of Re.1/- thereafter.
ADDITIONAL INVESTMENT/MULTIPLES FOR EXISTING INVESTORS:
Rs.1,000/- and in multiples of Re.1/-thereafter.
LOAD STRUCTURE:| ENTRY LOAD | Not Applicable |
| EXIT LOAD | 0.25 % of the applicable NAV, if
redeemed on or before 90 days from the
date of allotment. |
Please refer to our Tata Mutual Fund website for fundamental changes, wherever applicable
| Company name | No. of Shares | Market Value Rs Lakhs | % of Assets |
| Equity & Equity Related Total | 65547.03 | 100.21 | |
| Aerospace And Defense | |||
| Bharat Dynamics Ltd. | 23436 | 228.59 | 0.35 |
| Auto Components | |||
| Uno Minda Ltd. | 77265 | 638.13 | 0.98 |
| Banks | |||
| Federal Bank Ltd. | 1336354 | 2373.63 | 3.63 |
| Indian Bank | 93772 | 478.99 | 0.73 |
| Capital Markets | |||
| Bse Ltd. | 75237 | 3486.26 | 5.33 |
| HDFC Asset Management Company Ltd. | 33438 | 1213.23 | 1.85 |
| Chemicals & Petrochemicals | |||
| Solar Industries India Ltd. | 9577 | 834.21 | 1.28 |
| Construction | |||
| Rail Vikas Nigam Ltd. | 283094 | 941.00 | 1.44 |
| Consumer Durables | |||
| Dixon Technologies (India) Ltd. | 22696 | 3162.88 | 4.84 |
| Voltas Ltd. | 148336 | 1958.18 | 2.99 |
| Kalyan Jewellers India Ltd. | 381909 | 1765.37 | 2.70 |
| Diversified | |||
| Godrej Industries Ltd. | 36245 | 397.83 | 0.61 |
| Electrical Equipment | |||
| Cg Power And Industrial Solutions Ltd. | 267644 | 1532.53 | 2.34 |
| Hitachi Energy India Ltd. | 5737 | 647.38 | 0.99 |
| Thermax Ltd. | 11861 | 385.30 | 0.59 |
| Ferrous Metals | |||
| Lloyds Metals & Energy Ltd. | 87111 | 889.49 | 1.36 |
| Fertilizers & Agrochemicals | |||
| Coromandel International Ltd. | 73547 | 1225.99 | 1.87 |
| Finance | |||
| Indian Renewable Energy Development Agency Ltd. | 384538 | 599.96 | 0.92 |
| Crisil | 10743 | 471.45 | 0.72 |
| Housing & Urban Development Corporation Ltd. | 212072 | 350.22 | 0.54 |
| Financial Technology (Fintech) | |||
| Pb Fintech Ltd. | 200965 | 2941.32 | 4.50 |
| One 97 Communications Ltd. | 193200 | 1381.28 | 2.11 |
| Gas | |||
| Petronet Lng Ltd. | 328845 | 931.62 | 1.42 |
| Healthcare Services | |||
| Max Healthcare Institute Ltd. | 333536 | 3262.32 | 4.99 |
| Fortis Healthcare Ltd. | 355114 | 2175.78 | 3.33 |
| Syngene International Ltd. | 104412 | 681.18 | 1.04 |
| It - Software | |||
| Persistent Systems Ltd. | 64015 | 3395.29 | 5.19 |
| Coforge Ltd. | 43126 | 3175.00 | 4.85 |
| Oracle Financials Services Soft Ltd. | 21285 | 1652.55 | 2.53 |
| Mphasis Ltd. | 47199 | 1060.68 | 1.62 |
| Industrial Manufacturing | |||
| Mazagon Dock Shipbuilders Ltd. | 32372 | 689.86 | 1.05 |
| Industrial Products | |||
| Cummins India Ltd. | 53668 | 1458.67 | 2.23 |
| Polycab India Ltd. | 14010 | 660.35 | 1.01 |
| Kei Industries Ltd. | 18429 | 565.80 | 0.87 |
| Leisure Services | |||
| Indian Hotels Co. Ltd. | 471496 | 3376.38 | 5.16 |
| Jubilant Foodworks Ltd. | 152171 | 952.74 | 1.46 |
| Oil | |||
| Oil India Ltd. | 296556 | 1016.30 | 1.55 |
| Petroleum Products | |||
| Hindustan Petroleum Corporation Ltd. | 317563 | 932.84 | 1.43 |
| Pharmaceuticals & Biotechnology | |||
| Lupin Ltd. | 152359 | 2901.91 | 4.44 |
| Ipca Laboratories Ltd. | 71975 | 975.51 | 1.49 |
| Aurobindo Pharma Ltd. | 72219 | 764.29 | 1.17 |
| Ajanta Pharma Ltd. | 21618 | 537.41 | 0.82 |
| Biocon Ltd. | 178221 | 539.03 | 0.82 |
| Power | |||
| Torrent Power Ltd. | 53006 | 669.44 | 1.02 |
| Realty | |||
| The Phoenix Mills Ltd. | 49560 | 767.24 | 1.17 |
| Godrej Properties Ltd. | 39490 | 764.64 | 1.17 |
| Oberoi Realty Ltd. | 39639 | 588.44 | 0.90 |
| Prestige Estates Projects Ltd. | 48937 | 551.32 | 0.84 |
| Telecom - Services | |||
| Indus Towers Ltd. | 475435 | 1537.32 | 2.35 |
| Textiles & Apparels | |||
| Page Industries Ltd. | 2616 | 1059.90 | 1.62 |
| Repo | 116.52 | 0.18 | |
| Portfolio Total | 65663.55 | 100.39 | |
| Net Current Liabilities | -259.68 | -0.39 | |
| Net Assets | 65403.87 | 100.00 | |
| Issuer Name | % to NAV |
| Bse Ltd. | 5.33 |
| Persistent Systems Ltd. | 5.19 |
| Indian Hotels Co. Ltd. | 5.16 |
| Max Healthcare Institute Ltd. | 4.99 |
| Coforge Ltd. | 4.85 |
| Dixon Technologies (india) Ltd. | 4.84 |
| Pb Fintech Ltd. | 4.50 |
| Lupin Laboratories Ltd. | 4.44 |
| Federal Bank Ltd. | 3.63 |
| Fortis Healthcare Ltd. | 3.33 |
| Total | 46.26 |
| Large Cap | 9.35% |
| Mid Cap | 90.65% |
| Small Cap | 0.00% |
| Market Capitalisation is as per list provided by AMFI. | |