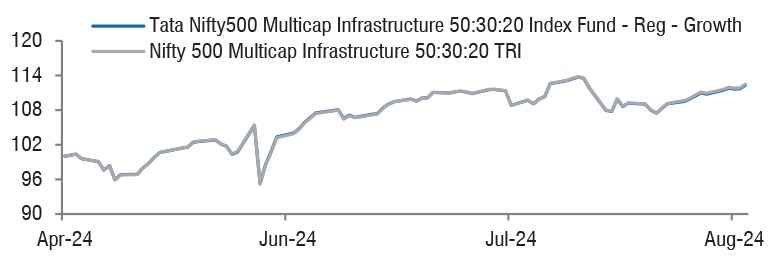
| Tata Nifty500 Multicap Infrastructure 50:30:20 Index Fund
(An open-ended scheme replicating/tracking Nifty500 Multicap Infrastructure 50:30:20 Index) |
As on 28th February 2025


|
An open-ended scheme replicating/tracking Nifty500 Multicap Infrastructure 50:30:20 Index.
INVESTMENT OBJECTIVE:The investment objective of the scheme is to provide returns, before expenses, that are in line with the performance of Nifty500 Multicap Infrastructure 50:30:20 Index (TRI), subject to tracking error. However ,there is no assurance or guarantee that the investment objective of the scheme will be achieved. The scheme does not assure or guarantee any returns
DATE OF ALLOTMENT:April 26, 2024
FUND MANAGER(S)Kapil Menon (Managing Since 26-Apr-24 and overall experience of 21 years)
ASSISTANT FUND MANAGER:Rakesh Indrajeet Prajapati (Managing Since 20-Dec-24 and overall experience of 19 years)
BENCHMARK:Nifty500 Multicap Infrastructure 50:30:20 Index (TRI)
NAV (in Rs.)| Direct - Growth | : 8.9494 |
| Direct - IDCW | : 8.9494 |
| Reg - Growth | : 8.8934 |
| Reg - IDCW | : 8.8934 |
| FUND SIZE | |
| Rs. 68.16 (Rs. in Cr.) | |
| MONTHLY AVERAGE AUM | |
| Rs. 72.73 (Rs. in Cr.) | |
| TURN OVER | |
| Portfolio Turnover (Equity component only) | 36.41% |
| EXPENSE RATIO** | |
| Direct | 0.44 |
| Regular | 1.09 |
| **Note: The rates specified are actual month end expenses charged as on Feb 28, 2025. The above ratio includes the GST on Investment Management Fees. The above ratio excludes, borrowing cost, wherever applicable. | |
| ^Risk-free rate based on the FBIL Overnight MIBOR rate of 6.4% as
on Feb 28, 2025 For calculation methodology |
MULTIPLES FOR NEW INVESTMENT:
Rs. 5,000/- and in multiples of Re. 1/- thereafter.
ADDITIONAL INVESTMENT/MULTIPLES FOR EXISTING INVESTORS:
Rs. 1,000/- and multiples of Re. 1/- thereafter.
LOAD STRUCTURE:| ENTRY LOAD | Not Applicable |
| EXIT LOAD |
0.25 % of the applicable NAV, if
redeemed on or before 15 days from the
date of allotment. |
Please refer to our Tata Mutual Fund website for fundamental changes, wherever applicable
| Company Name | No. of Shares | Market Value Rs Lakhs | % of assets |
| Equity & Equity Related Total | 6814.32 | 99.98 | |
| Agricultural, Commercial & Construction Vehicles | |||
| Ashok Leyland Ltd. | 42311 | 90.10 | 1.32 |
| BEML Ltd. | 819 | 20.10 | 0.29 |
| Auto Components | |||
| Bharat Forge Ltd. | 7732 | 78.60 | 1.15 |
| Tube Investments Of India Ltd.. | 3153 | 77.63 | 1.14 |
| MRF Ltd. | 59 | 62.17 | 0.91 |
| Balkrishna Industries Ltd. | 2374 | 62.10 | 0.91 |
| Amara Raja Energy & Mobility Ltd. | 5255 | 51.45 | 0.75 |
| Exide Industries Ltd. | 13442 | 46.75 | 0.69 |
| Apollo Tyres Ltd. | 9831 | 36.80 | 0.54 |
| Asahi India Glass Ltd. | 4722 | 29.07 | 0.43 |
| Ramkrishna Forgings Ltd. | 4408 | 28.56 | 0.42 |
| Cie Automotive India Ltd. | 5464 | 20.55 | 0.30 |
| Cement & Cement Products | |||
| Ultratech Cement Ltd. | 1861 | 188.49 | 2.77 |
| Grasim Industries Ltd. | 6069 | 139.99 | 2.05 |
| J K Cement Ltd. | 1235 | 54.21 | 0.80 |
| The Ramco Cements Ltd. | 5444 | 45.13 | 0.66 |
| Dalmia Bharat Ltd. | 2361 | 39.89 | 0.59 |
| ACC Ltd. | 2009 | 36.53 | 0.54 |
| Jk Lakshmi Cement Ltd. | 2663 | 17.88 | 0.26 |
| Construction | |||
| Larsen & Toubro Ltd. | 19224 | 608.22 | 8.92 |
| Kalpataru Projects International Ltd. | 4875 | 42.86 | 0.63 |
| Kec International Ltd. | 5568 | 38.22 | 0.56 |
| Nbcc India Ltd. | 44414 | 32.36 | 0.47 |
| NCC Ltd. | 17519 | 30.66 | 0.45 |
| Ircon International Ltd. | 13985 | 19.81 | 0.29 |
| Pnc Infratech Ltd. | 4843 | 12.54 | 0.18 |
| Electrical Equipment | |||
| Suzlon Energy Ltd. | 350526 | 174.25 | 2.56 |
| Ge Vernova T&D India Ltd. | 4394 | 58.80 | 0.86 |
| Inox Wind Ltd. | 28501 | 42.81 | 0.63 |
| Gas | |||
| Petronet Lng Ltd. | 22140 | 62.72 | 0.92 |
| Aegis Logistics Ltd. | 5393 | 41.00 | 0.60 |
| Indraprastha Gas Ltd. | 20717 | 39.25 | 0.58 |
| Gujarat State Petronet Ltd. | 12351 | 33.63 | 0.49 |
| Mahanagar Gas Ltd. | 2443 | 30.23 | 0.44 |
| Gujarat Gas Ltd. | 5094 | 18.87 | 0.28 |
| Healthcare Services | |||
| Max Healthcare Institute Ltd. | 21951 | 214.70 | 3.15 |
| Apollo Hospitals Enterprise Ltd. | 1652 | 99.99 | 1.47 |
| Krishna Institute Of Medical Sciences Ltd. | 10530 | 54.87 | 0.80 |
| Narayana Hrudayalaya Ltd. | 2913 | 42.08 | 0.62 |
| Aster Dm Healthcare Ltd. | 9409 | 37.91 | 0.56 |
| Industrial Manufacturing | |||
| Kaynes Technology India Ltd. | 1162 | 48.16 | 0.71 |
| Praj Industries Ltd. | 5288 | 25.83 | 0.38 |
| Titagarh Rail Systems Ltd. | 3437 | 23.96 | 0.35 |
| Industrial Products | |||
| Cummins India Ltd. | 4005 | 108.85 | 1.60 |
| Elgi Equipments Ltd. | 9264 | 39.66 | 0.58 |
| Kirloskar Oil Engines Ltd. | 3567 | 20.55 | 0.30 |
| Leisure Services | |||
| Indian Hotels Co. Ltd. | 26002 | 186.20 | 2.73 |
| Eih Ltd. | 9169 | 29.27 | 0.43 |
| Lemon Tree Hotels Ltd. | 21147 | 25.74 | 0.38 |
| Oil | |||
| Oil & Natural Gas Co. | 63342 | 142.68 | 2.09 |
| Petroleum Products | |||
| Reliance Industries Ltd. | 65780 | 789.43 | 11.58 |
| Hindustan Petroleum Corporation Ltd. | 28373 | 83.35 | 1.22 |
| Bharat Petroleum Corporation Ltd. | 31607 | 75.00 | 1.10 |
| Indian Oil Corporation Ltd. | 61175 | 69.43 | 1.02 |
| Castrol India Ltd. | 20757 | 44.14 | 0.65 |
| Power | |||
| NTPC Ltd. | 77326 | 240.83 | 3.53 |
| Power Grid Corporation Of India Ltd. | 73975 | 185.57 | 2.72 |
| Tata Power Company Ltd. | 27566 | 93.50 | 1.37 |
| Cesc Ltd. | 27056 | 35.39 | 0.52 |
| Jaiprakash Power Ventures Ltd. | 204574 | 27.33 | 0.40 |
| Realty | |||
| Godrej Properties Ltd. | 4456 | 86.28 | 1.27 |
| Dlf Ltd. | 10464 | 66.50 | 0.98 |
| Brigade Enterprises Ltd. | 5927 | 56.13 | 0.82 |
| Oberoi Realty Ltd. | 3476 | 51.60 | 0.76 |
| Telecom - Equipment & Accessories | |||
| Tejas Networks Ltd. | 3346 | 23.78 | 0.35 |
| Telecom - Services | |||
| Bharti Airtel Ltd. | 43800 | 687.75 | 10.09 |
| Indus Towers Ltd. | 36709 | 118.70 | 1.74 |
| Vodafone Idea Ltd. | 766795 | 57.89 | 0.85 |
| Tata Communications Ltd. | 3468 | 46.90 | 0.69 |
| Hfcl Ltd. | 39347 | 31.16 | 0.46 |
| Transport Infrastructure | |||
| Adani Ports And Special Economic Zone Ltd. | 12037 | 128.72 | 1.89 |
| Gmr Airports Ltd. | 105921 | 73.58 | 1.08 |
| Transport Services | |||
| Interglobe Aviation Ltd. | 3203 | 143.41 | 2.10 |
| Container Corporation Of India Ltd. | 8142 | 50.78 | 0.75 |
| The Great Eastern Shipping Co.Ltd. | 4254 | 34.49 | 0.51 |
| Repo | 4.20 | 0.06 | |
| Portfolio Total | 6818.52 | 100.04 | |
| Net Current Liabilities | -2.39 | -0.04 | |
| Net Assets | 6816.13 | 100.00 | |
| Issuer Name | % to NAV |
| Reliance Industries Ltd. | 11.58 |
| Bharti Airtel Ltd. | 10.09 |
| Larsen & Toubro Ltd. | 8.92 |
| NTPC Ltd. | 3.53 |
| Max Healthcare Institute Ltd. | 3.15 |
| Ultratech Cement Ltd. | 2.77 |
| Indian Hotels Co. Ltd. | 2.73 |
| Power Grid Corporation Of India Ltd. | 2.72 |
| Suzlon Energy Ltd. | 2.56 |
| Interglobe Aviation Ltd. | 2.10 |
| Total | 50.15 |
| Large Cap | 55.58% |
| Mid Cap | 27.90% |
| Small Cap | 16.52% |
| Market Capitalisation is as per list provided by AMFI. | |