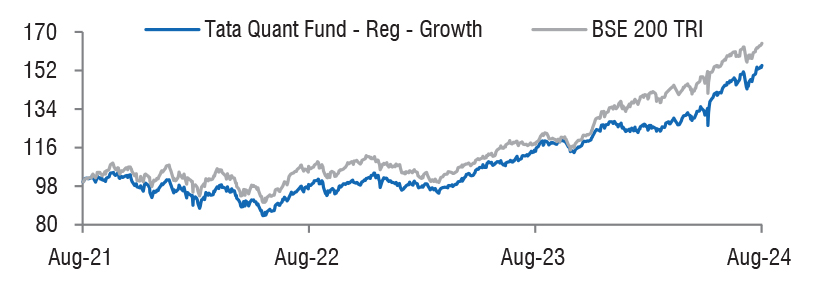
| Tata Quant Fund
(An Open Ended Equity Scheme following quant based investing theme) |
As on 28th February 2025


|
Primarily focuses on investing in equity and equity related instruments following quant based investing theme.
INVESTMENT OBJECTIVE:The investment objective of the scheme is to generate
medium to long-term capital appreciation by investing in
equity and equity related instruments selected based on a
quantitative model (Quant Model).
However, there is no assurance or guarantee that the
investment objective of the Scheme will be achieved. The
scheme does not assure or guarantee any returns.
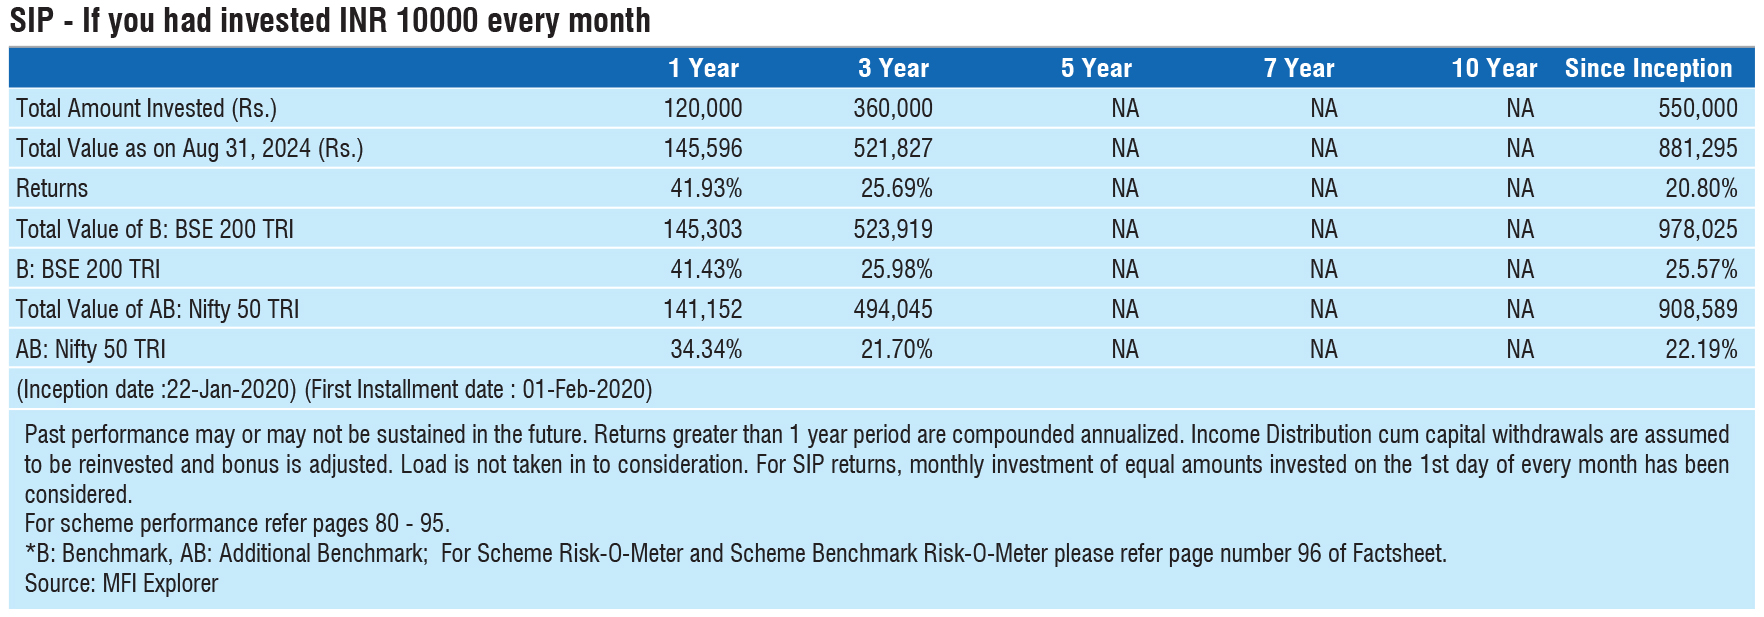
January 22, 2020
FUND MANAGER(S)Sailesh Jain (Managing Since 22-Jan-20 and overall experience of 22 years)
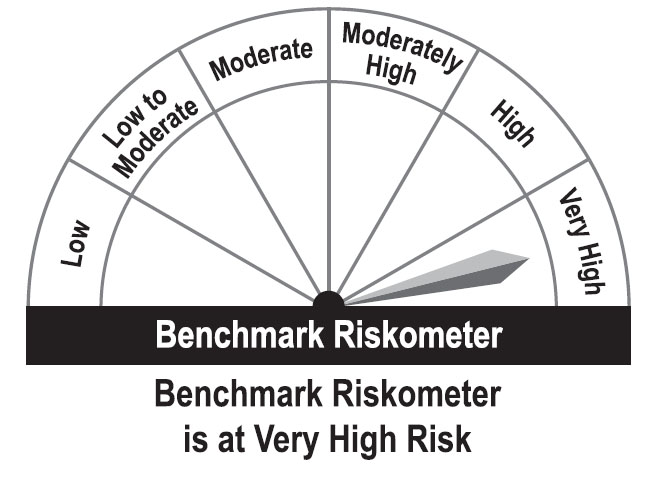
BENCHMARK:BSE 200 TRI
NAV (in Rs.)| Direct - IDCW | : 14.7117 |
| Direct - Growth | : 14.7117 |
| Regular - Growth | : 13.5337 |
| Regular - IDCW | : 13.5337 |
| FUND SIZE | |
| Rs. 61.70 (Rs. in Cr.) | |
| MONTHLY AVERAGE AUM | |
| Rs. 64.98 (Rs. in Cr.) | |
| TURN OVER | |
| Portfolio Turnover (Equity component only) | 331.98% |
| EXPENSE RATIO** | |
| Direct | 0.91 |
| Regular | 2.42 |
| **Note: The rates specified are actual month end expenses charged as on Feb 28, 2025. The above ratio includes the GST on Investment Management Fees. The above ratio excludes, borrowing cost, wherever applicable. | |
| VOLATILITY MEASURES^ | FUND | BENCHMARK |
| Std. Dev (Annualised) | 14.21 | 14.20 |
| Sharpe Ratio | 0.35 | 0.45 |
| Portfolio Beta | 0.88 | NA |
| R Squared | 0.81 | NA |
| Treynor | 0.49 | NA |
| Jenson | -0.04 | NA |
| ^Risk-free rate based on the FBIL Overnight MIBOR rate of 6.65% as
on Feb 28, 2025 For calculation methodology | ||
MULTIPLES FOR NEW INVESTMENT:
Growth option: Rs. 5,000/- and in multiples of Re. 1/- thereafter.
IDCW (payout): Rs 5,000/- and in multiple of Re.1/-
thereafter
MULTIPLES FOR EXISTING INVESTORS:
Rs. 1,000/- and multiples of Re. 1/- thereafter.
LOAD STRUCTURE:| ENTRY LOAD | Not Applicable |
| EXIT LOAD |
• Exit Load is Nil, if the withdrawal amount or
switched out amount is not more than 12% of the
original cost of investment on or before expiry of
365 days from the date of allotment. • Exit load is 1% of the applicable NAV if the withdrawal amount or switched out amount is more than 12% of the original cost of investment on or before expiry of 365 days from the date of allotment. • No Exit load will be charged for redemption or switch out after expiry of 365 days from the date of allotment. |
Please refer to our Tata Mutual Fund website for fundamental changes, wherever applicable
| Company name | No. of Shares | Market Value Rs Lakhs | % of Assets |
| Equity & Equity Related Total | 5794.63 | 93.94 | |
| Agricultural, Commercial & Construction Vehicles | |||
| Ashok Leyland Ltd. | 99663 | 212.22 | 3.44 |
| Auto Components | |||
| Balkrishna Industries Ltd. | 4351 | 113.81 | 1.84 |
| Automobiles | |||
| Eicher Motors Ltd. | 1820 | 86.88 | 1.41 |
| Mahindra & Mahindra Ltd. | 394 | 10.19 | 0.17 |
| Banks | |||
| ICICI Bank Ltd. | 40183 | 483.84 | 7.84 |
| Kotak Mahindra Bank Ltd. | 24941 | 474.61 | 7.69 |
| HDFC Bank Ltd. | 16369 | 283.58 | 4.60 |
| State Bank Of India | 2178 | 15.00 | 0.24 |
| Diversified Metals | |||
| Vedanta Ltd. | 62492 | 246.69 | 4.00 |
| Electrical Equipment | |||
| Siemens Ltd. | 588 | 27.19 | 0.44 |
| Ferrous Metals | |||
| Jsw Steel Ltd. | 46154 | 438.79 | 7.11 |
| Fertilizers & Agrochemicals | |||
| Upl Ltd. | 52425 | 331.82 | 5.38 |
| Pi Industries Ltd. | 397 | 11.97 | 0.19 |
| Finance | |||
| Mahindra And Mahindra Financial Services Ltd. | 76155 | 206.08 | 3.34 |
| Muthoot Finance Ltd. | 4622 | 98.58 | 1.60 |
| Sbi Cards And Payment Services Ltd. | 7175 | 60.18 | 0.98 |
| Financial Technology (Fintech) | |||
| Pb Fintech Ltd. | 18995 | 278.01 | 4.51 |
| Gas | |||
| Indraprastha Gas Ltd. | 216806 | 410.80 | 6.66 |
| Petronet Lng Ltd. | 17490 | 49.55 | 0.80 |
| It - Software | |||
| Wipro Ltd. | 152161 | 422.48 | 6.85 |
| Oracle Financials Services Soft Ltd. | 2715 | 210.79 | 3.42 |
| Tech Mahindra Ltd. | 13521 | 201.17 | 3.26 |
| Coforge Ltd. | 2499 | 183.98 | 2.98 |
| HCL Technologies Ltd. | 8736 | 137.60 | 2.23 |
| Industrial Manufacturing | |||
| Honeywell Automation India Ltd. | 89 | 29.99 | 0.49 |
| Leisure Services | |||
| Indian Hotels Co. Ltd. | 4615 | 33.05 | 0.54 |
| Pharmaceuticals & Biotechnology | |||
| Biocon Ltd. | 133963 | 405.17 | 6.57 |
| Abbott India Ltd. | 183 | 55.62 | 0.90 |
| Retailing | |||
| Info Edge (India) Ltd. | 3782 | 264.46 | 4.29 |
| Textiles & Apparels | |||
| Page Industries Ltd. | 26 | 10.53 | 0.17 |
| Repo | 386.31 | 6.26 | |
| Portfolio Total | 6180.94 | 100.20 | |
| Net Current Liabilities | -11.26 | -0.20 | |
| Net Assets | 6169.68 | 100.00 | |
| Issuer Name | % to NAV |
| ICICI Bank Ltd. | 7.84 |
| Kotak Mahindra Bank | 7.69 |
| Jsw Steel Ltd. | 7.11 |
| Wipro Ltd. | 6.85 |
| Indraprastha Gas Ltd. | 6.66 |
| Biocon Ltd. | 6.57 |
| Upl Ltd. | 5.38 |
| HDFC Bank Ltd. | 4.60 |
| Pb Fintech Ltd. | 4.51 |
| Info Edge (india) Ltd. | 4.29 |
| Total | 61.50 |
| Large Cap | 53.37% |
| Mid Cap | 46.63% |
| Small Cap | 0.00% |
| Market Capitalisation is as per list provided by AMFI. | |