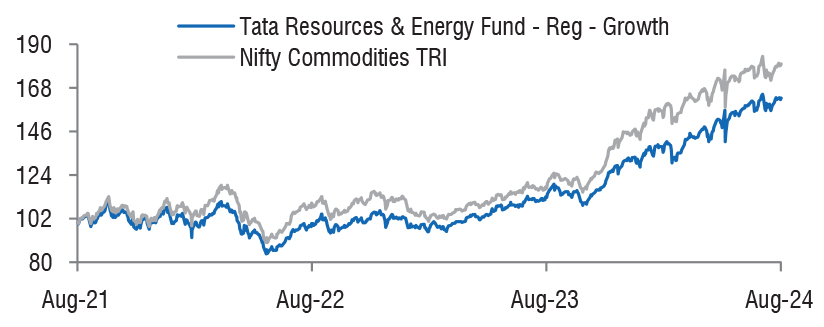
| Tata Resources & Energy Fund
(An open ended equity scheme investing in Resources and Energy Sector) |
As on 28th February 2025


|
Primarily focuses on investment in at least 80% of its net assets in equity/equity related instruments of the companies in the Resources & Energy sectors in India.
INVESTMENT OBJECTIVE:The investment objective of the scheme is to provide long term capital appreciation by investing atleast 80% of it’s net assets in equity/equity related instruments of the companies in the Resources& Energy sectors in India.However, there is no assurance or guarantee that the investment objective of the Scheme will be achieved.The Scheme does not assure or guarantee any returns.
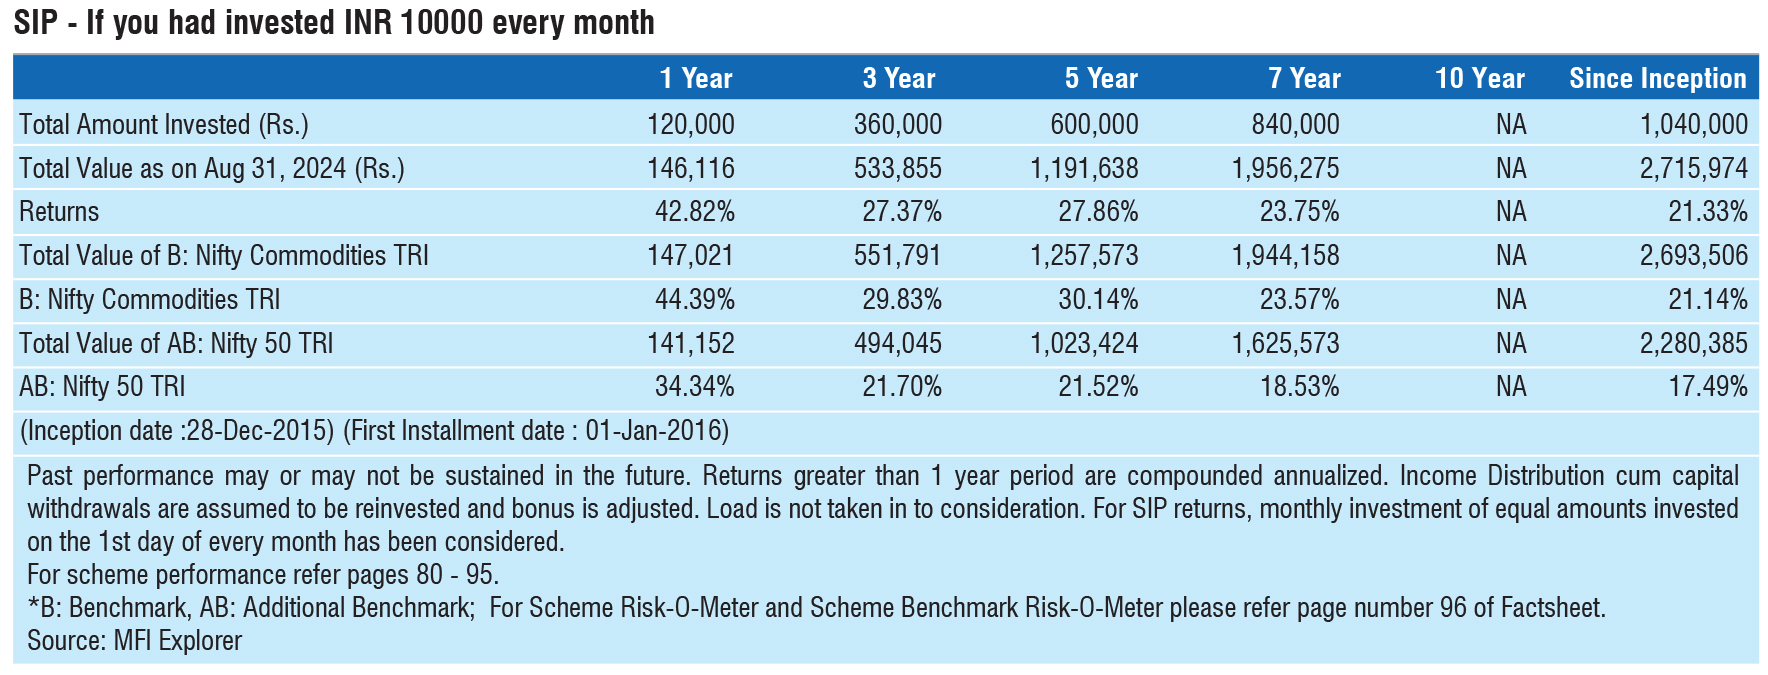
DATE OF ALLOTMENT:December 28,2015
FUND MANAGER(S)Satish Chandra Mishra (Managing Since 09-Mar-21 and overall experience of 18 years) (Managed in the past from 09-Nov-2018 till 08-Mar-2021 as Lead Fund Manager)
BENCHMARK:Nifty Commodities TRI
NAV (in Rs.)| Direct - IDCW | : 43.6237 |
| Direct - Growth | : 43.6237 |
| Regular - IDCW | : 34.2226 |
| Regular - Growth | : 37.4149 |
| FUND SIZE | |
| Rs.928.70 (Rs. in Cr.) | |
| MONTHLY AVERAGE AUM | |
| Rs. 975.95(Rs. in Cr.) | |
| TURN OVER | |
| Portfolio Turnover (Equity component only) | 22.42% |
| EXPENSE RATIO** | |
| Direct | 0.64 |
| Regular | 2.22 |
| **Note: The rates specified are actual month end expenses charged as on Feb 28, 2025. The above ratio includes the GST on Investment Management Fees. The above ratio excludes, borrowing cost, wherever applicable. | |
| VOLATILITY MEASURES^ | FUND | BENCHMARK |
| Std. Dev (Annualised) | 17.19 | 19.54 |
| Sharpe Ratio | 0.28 | 0.33 |
| Portfolio Beta | 0.82 | NA |
| R Squared | 0.91 | NA |
| Treynor | 0.50 | NA |
| Jenson | -0.03 | NA |
| ^Risk-free rate based on the FBIL Overnight MIBOR rate of 6.4% as
on Feb 28, 2025 For calculation methodology | ||
MULTIPLES FOR NEW INVESTMENT:
Rs. 5,000/- and in multiples of Re. 1/- thereafter.
ADDITIONAL INVESTMENT/MULTIPLES FOR EXISTING INVESTORS:
Rs. 1,000/- and multiples of Re. 1/- thereafter.
LOAD STRUCTURE:| ENTRY LOAD | Not Applicable |
| EXIT LOAD | 0.25% of NAV if redeemed/switched out
before 30 days from the date of allotment. |
Please refer to our Tata Mutual Fund website for fundamental changes, wherever applicable
| Company name | No. of Shares | Market Value Rs Lakhs | % of Assets |
| Equity & Equity Related Total | 91207.09 | 98.21 | |
| Agricultural Food & Other Products | |||
| Ccl Products India Ltd. | 250000 | 1450.50 | 1.56 |
| Cement & Cement Products | |||
| Ultratech Cement Ltd. | 70000 | 7089.92 | 7.63 |
| Ambuja Cements Ltd. | 700000 | 3254.65 | 3.50 |
| The Ramco Cements Ltd. | 253089 | 2098.11 | 2.26 |
| Grasim Industries Ltd. | 89011 | 2053.17 | 2.21 |
| Dalmia Bharat Ltd. | 115000 | 1943.10 | 2.09 |
| Shree Cement Ltd. | 6887 | 1879.05 | 2.02 |
| Chemicals & Petrochemicals | |||
| Navin Fluorine International Ltd. | 80000 | 3009.80 | 3.24 |
| Srf Ltd. | 41000 | 1146.11 | 1.23 |
| Aarti Industries Ltd. | 200000 | 752.00 | 0.81 |
| Deepak Nitrite Ltd. | 25700 | 475.78 | 0.51 |
| Chemcon Speciality Chemicals Ltd. | 100000 | 190.96 | 0.21 |
| Consumable Fuels | |||
| Coal India Ltd. | 600000 | 2216.10 | 2.39 |
| Diversified | |||
| Dcm Shriram Ltd. | 130800 | 1253.06 | 1.35 |
| Diversified Metals | |||
| Vedanta Ltd. | 700000 | 2763.25 | 2.98 |
| Ferrous Metals | |||
| Tata Steel Ltd. | 3000000 | 4116.00 | 4.43 |
| Jindal Steel & Power Ltd. | 250000 | 2140.38 | 2.30 |
| Jsw Steel Ltd. | 210000 | 1996.47 | 2.15 |
| Jindal Stainless Ltd. | 175600 | 1027.00 | 1.11 |
| Fertilizers & Agrochemicals | |||
| Paradeep Phosphates Ltd. | 3833386 | 3330.83 | 3.59 |
| Sumitomo Chemical India Ltd. | 400000 | 1842.40 | 1.98 |
| Upl Ltd. | 200000 | 1265.90 | 1.36 |
| Sharda Cropchem Ltd. | 201551 | 998.79 | 1.08 |
| Coromandel International Ltd. | 49414 | 823.71 | 0.89 |
| Upl Ltd. - (Partly Paidup) Right Entitlements - 26-11-2024 | 25000 | 88.30 | 0.10 |
| Finance | |||
| Acme Solar Holdings Ltd. | 400000 | 772.40 | 0.83 |
| Gas | |||
| Mahanagar Gas Ltd. | 225000 | 2784.38 | 3.00 |
| Industrial Manufacturing | |||
| Dee Development Engineers Ltd. | 500000 | 997.75 | 1.07 |
| Industrial Products | |||
| Apl Apollo Tubes Ltd. | 130000 | 1870.64 | 2.01 |
| Ratnamani Metals & Tubes Ltd. | 25658 | 630.83 | 0.68 |
| Rhi Magnesita India Ltd. | 100000 | 391.70 | 0.42 |
| Minerals & Mining | |||
| Moil Ltd. | 600000 | 1741.50 | 1.88 |
| NMDC Ltd. | 2500000 | 1562.00 | 1.68 |
| Non - Ferrous Metals | |||
| Hindalco Industries Ltd. | 195000 | 1236.98 | 1.33 |
| Oil | |||
| Oil & Natural Gas Co. | 1050000 | 2365.13 | 2.55 |
| Petroleum Products | |||
| Reliance Industries Ltd. | 300000 | 3600.30 | 3.88 |
| Bharat Petroleum Corporation Ltd. | 1100000 | 2610.30 | 2.81 |
| Castrol India Ltd. | 1000000 | 2126.30 | 2.29 |
| Hindustan Petroleum Corporation Ltd. | 650000 | 1909.38 | 2.06 |
| Indian Oil Corporation Ltd. | 1100000 | 1248.39 | 1.34 |
| Power | |||
| NTPC Ltd. | 1400000 | 4360.30 | 4.70 |
| Adani Power Ltd. | 445000 | 2131.33 | 2.29 |
| Tata Power Company Ltd. | 595000 | 2018.24 | 2.17 |
| Adani Energy Solutions Ltd. | 281967 | 1835.32 | 1.98 |
| Cesc Ltd. | 1200000 | 1569.48 | 1.69 |
| Power Grid Corporation Of India Ltd. | 600000 | 1505.10 | 1.62 |
| Nhpc Ltd. | 1500000 | 1093.50 | 1.18 |
| Textiles & Apparels | |||
| Ganesha Ecosphere Ltd. | 125000 | 1640.50 | 1.77 |
| Repo | 805.17 | 0.87 | |
| Portfolio Total | 92012.26 | 99.08 | |
| Cash / Net Current Asset | 858.15 | 0.92 | |
| Net Assets | 92870.41 | 100.00 | |
| Issuer Name | % to NAV |
| Ultratech Cement Ltd. | 7.63 |
| NTPC Ltd. | 4.70 |
| Tata Steel Ltd. | 4.43 |
| Reliance Industries Ltd. | 3.88 |
| Paradeep Phosphates Ltd | 3.59 |
| Ambuja Cements Ltd. | 3.50 |
| Navin Fluorine International Ltd. | 3.24 |
| Mahanagar Gas Ltd. | 3.00 |
| Vedanta Ltd. | 2.98 |
| Bpcl | 2.81 |
| Total | 39.76 |
| Large Cap | 50.87% |
| Mid Cap | 18.89% |
| Small Cap | 30.24% |
| Market Capitalisation is as per list provided by AMFI. | |