| Tata Small Cap Fund
(An open-ended Equity Scheme predominantly investing in small cap stocks) |
As on 28th February 2025


|
An equity scheme with focus towards small cap stocks
INVESTMENT OBJECTIVE:The investment objective of the scheme is to generate long term capital appreciation by predominantly investing in equity and equity related instruments of small cap companies. However, there is no assurance or guarantee that the investment objective of the Scheme will be achieved. The Scheme does not assure or guarantee any returns.
DATE OF ALLOTMENT:November 12,2018
FUND MANAGER(S)Chandraprakash Padiyar (Managing Since 12-Nov-18 and overall experience of 24 years)
ASSISTANT FUND MANAGER:Jeetendra Khatri (Managing Since 03-Oct-23 and overall experience of 17 years)
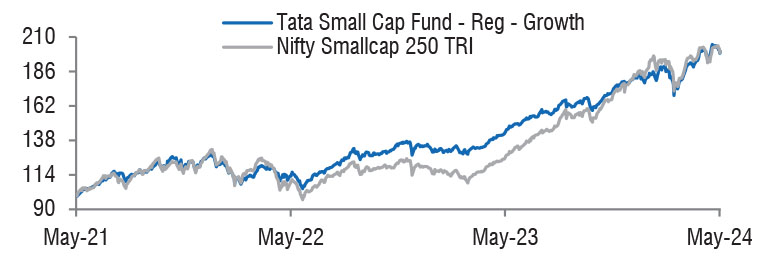
BENCHMARK:Nifty Smallcap 250 TRI
NAV (in Rs.)| Direct - IDCW | : 37.6152 |
| Direct - Growth | : 37.6152 |
| Regular - IDCW | : 33.6712 |
| Regular - Growth | : 33.6712 |
| FUND SIZE | |
| Rs. 8274.12 (Rs. in Cr.) | |
| MONTHLY AVERAGE AUM | |
| Rs. 8710.36 (Rs. in Cr.) | |
| TURN OVER | |
| Portfolio Turnover (Equity component only) | 10.96% |
| EXPENSE RATIO** | |
| Direct | 0.37 |
| Regular | 1.73 |
| **Note: The rates specified are actual month end expenses charged as on Feb 28, 2025. The above ratio includes the GST on Investment Management Fees. The above ratio excludes, borrowing cost, wherever applicable. | |
| VOLATILITY MEASURES^ | FUND | BENCHMARK |
| Std. Dev (Annualised) | 15.86 | 20.11 |
| Sharpe Ratio | 0.79 | 0.56 |
| Portfolio Beta | 0.71 | NA |
| R Squared | 0.85 | NA |
| Treynor | 1.48 | NA |
| Jenson | 0.38 | NA |
| ^Risk-free rate based on the FBIL Overnight MIBOR rate of 6.4% as
on Feb 28, 2025 For calculation methodology | ||
MULTIPLES FOR NEW INVESTMENT:
Rs. 5,000/- and in multiples of Re. 1/- thereafter.
ADDITIONAL INVESTMENT/MULTIPLES FOR EXISTING INVESTORS:
Rs. 1,000/- and multiples of Re. 1/- thereafter.
LOAD STRUCTURE:| ENTRY LOAD | Not Applicable |
| EXIT LOAD |
1) Redemption/Switch-out/SWP/STP on
or before expiry of 12 Months from the
date of allotment: If the withdrawal
amount or switched out amount is not
more than 12% of the original cost of
investment - NIL 2) Redemption/Switch-out/SWP/STP on or before expiry of 12 Months from the date of allotment: If the withdrawal amount or switched out amount is more than 12% of the original cost of investment - 1% 3) Redemption/Switch-out/SWP/STP after expiry of 12 Months from the date of allotment - NIL (w.e.f. 03 June, 2019) |
Please refer to our Tata Mutual Fund website for fundamental changes, wherever applicable
| Company Name | No. of Shares | Market Value Rs Lakhs | % of assets |
| Equity & Equity Related Total | 770061.78 | 93.04 | |
| Agricultural Food & Other Products | |||
| Agro Tech Foods Ltd. | 1782421 | 14339.58 | 1.73 |
| Balrampur Chini Mills Ltd. | 502135 | 2230.73 | 0.27 |
| Auto Components | |||
| Cie Automotive India Ltd. | 3232701 | 12156.57 | 1.47 |
| Ask Automotive Ltd. | 2958073 | 10746.68 | 1.30 |
| Sundaram Clayton Ltd. | 527911 | 10275.26 | 1.24 |
| Mm Forgings Ltd. | 1576286 | 5325.48 | 0.64 |
| Automotive Axles Ltd. | 143392 | 2349.76 | 0.28 |
| Banks | |||
| IDFC First Bank Ltd. | 49950000 | 29165.81 | 3.52 |
| Dcb Bank Ltd. | 11340118 | 11822.07 | 1.43 |
| Beverages | |||
| Radico Khaitan Ltd. | 731475 | 15163.84 | 1.83 |
| Capital Markets | |||
| Uti Asset Management Company Ltd. | 1965500 | 18493.39 | 2.24 |
| Nippon Life India Asset Management Ltd. | 1820266 | 9343.43 | 1.13 |
| Chemicals & Petrochemicals | |||
| Sudarshan Chemical Industries Ltd. | 4506389 | 38980.26 | 4.71 |
| Basf India Ltd. | 763051 | 32707.04 | 3.95 |
| Elantas Beck India Ltd. | 209256 | 17591.42 | 2.13 |
| Pcbl Ltd. | 3600000 | 12888.00 | 1.56 |
| Commercial Services & Supplies | |||
| Quess Corp Ltd. | 4804600 | 28695.47 | 3.47 |
| Redington (India) Ltd. | 11227712 | 25186.00 | 3.04 |
| Consumer Durables | |||
| Greenply Industries Ltd. | 5663322 | 15438.22 | 1.87 |
| Akzo Nobel India Ltd. | 287484 | 8941.47 | 1.08 |
| Vip Industries Ltd. | 2117326 | 6405.97 | 0.77 |
| Eureka Forbes Ltd. | 1121339 | 5462.04 | 0.66 |
| Diversified | |||
| Godrej Industries Ltd. | 3087620 | 33889.72 | 4.10 |
| Fertilizers & Agrochemicals | |||
| Rallis India Ltd. | 2206356 | 4626.73 | 0.56 |
| Finance | |||
| Acme Solar Holdings Ltd. | 3504521 | 6767.23 | 0.82 |
| Healthcare Services | |||
| Krsnaa Diagnostics Ltd. | 2496000 | 17726.59 | 2.14 |
| Healthcare Global Enterprises Ltd. | 3347532 | 16792.89 | 2.03 |
| Household Products | |||
| Eveready Industries India Ltd. | 1772916 | 5352.43 | 0.65 |
| It - Services | |||
| Netweb Technologies India Ltd. | 266002 | 3867.40 | 0.47 |
| It - Software | |||
| C.E. Info Systems Ltd. | 1160843 | 19325.71 | 2.34 |
| Industrial Manufacturing | |||
| Honda India Power Products Ltd. | 515978 | 10034.48 | 1.21 |
| Industrial Products | |||
| Kirloskar Pneumatic Company Ltd. | 2979004 | 29773.66 | 3.60 |
| Time Technoplast Ltd. | 7101529 | 25384.42 | 3.07 |
| Usha Martin Ltd. | 4905077 | 14506.77 | 1.75 |
| Graphite India Ltd. | 3701754 | 14490.52 | 1.75 |
| Ksb Ltd. | 2055590 | 12682.99 | 1.53 |
| Kirloskar Ferrous Industries Ltd. | 2425601 | 11038.91 | 1.33 |
| Finolex Cables Ltd. | 900700 | 7357.37 | 0.89 |
| Carborundum Universal Ltd. | 800000 | 6653.20 | 0.80 |
| R R Kabel Ltd. | 539278 | 4800.92 | 0.58 |
| Vardhman Special Steels Ltd. | 2269346 | 4581.36 | 0.55 |
| Leisure Services | |||
| Wonderla Holidays Ltd. | 4220214 | 26981.94 | 3.26 |
| Samhi Hotels Ltd. | 5953157 | 8555.88 | 1.03 |
| Other Construction Materials | |||
| Ramco Industries Ltd. | 2281581 | 5235.32 | 0.63 |
| Pharmaceuticals & Biotechnology | |||
| Suven Pharmaceuticals Ltd. | 1329000 | 16143.36 | 1.95 |
| Wockhardt Ltd. | 1350000 | 15599.25 | 1.89 |
| Hikal Ltd. | 3300000 | 11573.10 | 1.40 |
| Alivus Life Sciences Ltd. | 627903 | 5556.31 | 0.67 |
| Natco Pharma Ltd. | 549064 | 4231.64 | 0.51 |
| Power | |||
| Powergrid Infrastructure Investment Trust | 1043500 | 837.93 | 0.10 |
| Realty | |||
| Anant Raj Ltd. | 3639258 | 16858.86 | 2.04 |
| Keystone Realtors Ltd. | 2734324 | 14167.90 | 1.71 |
| Retailing | |||
| Shoppers Stop Ltd. | 3340751 | 17478.81 | 2.11 |
| Textiles & Apparels | |||
| Gokaldas Exports Ltd. | 1503967 | 12235.52 | 1.48 |
| Ganesha Ecosphere Ltd. | 336348 | 4414.23 | 0.53 |
| Transport Infrastructure | |||
| Gujarat Pipavav Port Ltd. | 10859605 | 13569.08 | 1.64 |
| Transport Services | |||
| Transport Corporation Of India Ltd. | 782332 | 7055.85 | 0.85 |
| Allcargo Global Logistics Ltd. | 17112968 | 5318.71 | 0.64 |
| Transindia Real Estate Ltd. | 3095712 | 886.30 | 0.11 |
| Repo | 36105.56 | 4.36 | |
| Portfolio Total | 806167.34 | 97.40 | |
| Cash / Net Current Asset | 21245.12 | 2.60 | |
| Net Assets | 827412.46 | 100.00 | |
| Issuer Name | % to NAV |
| Sudarshan Chemical Industries Ltd. | 4.71 |
| Godrej Industries Ltd. | 4.10 |
| Basf India Ltd. | 3.95 |
| Kirloskar Pneumatic Company Ltd. | 3.60 |
| IDFC First Bank Ltd. | 3.52 |
| Quess Corp Ltd. | 3.47 |
| Wonderla Holidays Ltd. | 3.26 |
| Time Technoplast Ltd. | 3.07 |
| Redington Ltd. | 3.04 |
| C.e. Info Systems Ltd. | 2.34 |
| Total | 35.06 |
| Large Cap | 0.00% |
| Mid Cap | 9.41% |
| Small Cap | 90.59% |
| Market Capitalisation is as per list provided by AMFI. | |