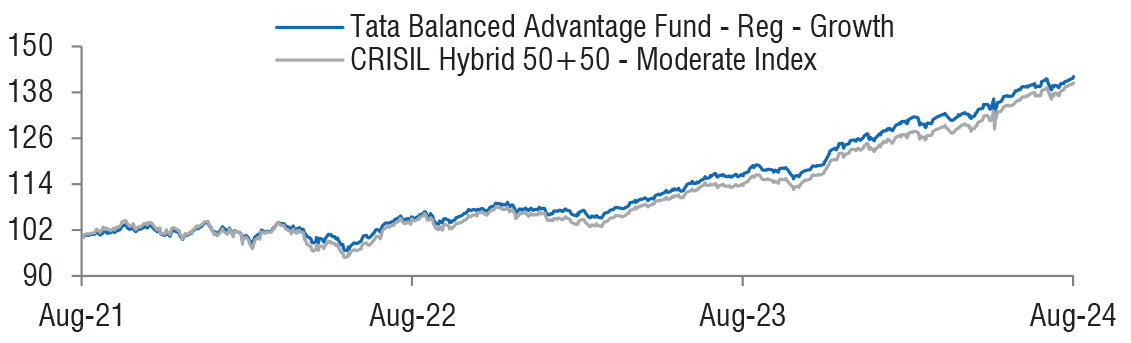
| Tata Balanced Advantage Fund
(An open ended dynamic asset allocation fund.) |
As on 28th February 2025


|
Dynamically investing in equity and equity related instruments, equity arbitrage opportunities and debt and money market instruments.
INVESTMENT OBJECTIVE:The investment objective of the Scheme is to provide capital appreciation and income distribution to the investors by using equity derivatives strategies, arbitrage opportunities and pure equity investments. However, there is no assurance or guarantee that the investment objective of the Scheme will be achieved. The scheme does not assure or guarantee any returns.
DATE OF ALLOTMENT:January 28,2019
FUND MANAGER(S)Rahul Singh ( Unhedged Equity Portfolio ) (Managing Since 28-Jan-19 and overall experience of 29 years),
Sailesh Jain (Hedged / Derivative exposure) (Managing Since 28-Jan-19 and overall experience of 22 years),
Akhil Mittal ( Fixed Income Portfolio) (Managing Since 28-Jan-19 and overall experience of 23 years)
CRISIL Hybrid 50+50 - Moderate Index
NAV (in Rs.)| Direct - IDCW | : 20.7915 |
| Direct - Growth | : 20.7915 |
| Regular - IDCW | : 18.8651 |
| Regular - Growth | : 18.8651 |
| FUND SIZE | |
| Rs.9754.44 (Rs. in Cr.) | |
| MONTHLY AVERAGE AUM | |
| Rs. 9977.24 (Rs. in Cr.) | |
| TURN OVER | |
| Portfolio Turnover (Equity component only) | 25.13% |
| EXPENSE RATIO** | |
| Direct | 0.43 |
| Regular | 1.72 |
| **Note: The rates specified are actual month end expenses charged as on Feb 28, 2025. The above ratio includes the GST on Investment Management Fees. The above ratio excludes, borrowing cost, wherever applicable. | |
| VOLATILITY MEASURES^ | FUND | BENCHMARK |
| Std. Dev (Annualised) | 6.99 | 7.66 |
| Sharpe Ratio | 0.42 | 0.41 |
| Portfolio Beta | 0.87 | NA |
| R Squared | 0.96 | NA |
| Treynor | 0.29 | NA |
| Jenson | 0.02 | NA |
| Portfolio Macaulay Duration | : | 4.33 Years |
| Modified Duration | : | 4.15 Years |
| Average Maturity | : | 8.7 Years |
| Annualized Yield to Maturity (For Debt Component)* | ||
| - Including Net Current Assets | : | 7.24% |
| *Computed on the invested amount for debt portfolio | ||
| Total stock in Portfolio | : | 74 |
| ^Risk-free rate based on the FBIL Overnight MIBOR rate of 6.5% as
on Feb 28, 2025 For calculation methodology | ||
MULTIPLES FOR NEW INVESTMENT:
Rs. 5,000/- and in multiples of Re. 1/- thereafter.
ADDITIONAL INVESTMENT/MULTIPLES FOR EXISTING INVESTORS:
Rs. 1,000/- and in multiples of Re. 1/- thereafter.
LOAD STRUCTURE:| ENTRY LOAD | Not Applicable |
| EXIT LOAD |
1) Redemption/Switch-out/SWP/STP on orbefore expiry of 90 days
from the date of allotment: If the withdrawal amount or switched out
amount is not more than 12% of the original cost of investment - NIL. 2) Redemption/Switch-out/SWP/STP on or before expiry of 90 days from the date of allotment: If the withdrawal amount or switched out amount is more than 12% of the original cost of investment - 1%. 3) Redemption / Switch-out/SWP/STP after expiry of 90 days from the date of allotment - NIL. w.e.f. 07 Jan, 2022 |
Please refer to our Tata Mutual Fund website for fundamental changes, wherever applicable
| Company name | % of Assets | ||
| Equity & Equity Related Total | 67.97 | ||
| Unhedge Positions | 51.50 | ||
| Auto Components | |||
| Craftsman Automation Ltd. | 0.31 | ||
| Automobiles | |||
| Mahindra & Mahindra Ltd. | 1.20 | ||
| Hero Motocorp Ltd. | 0.86 | ||
| Tata Motors Ltd. | 0.55 | ||
| Bajaj Auto Ltd. | 0.00 | ||
| Banks | |||
| HDFC Bank Ltd. | 3.87 | ||
| ICICI Bank Ltd. | 2.83 | ||
| Axis Bank Ltd. | 1.08 | ||
| State Bank Of India | 1.07 | ||
| Kotak Mahindra Bank Ltd. | 0.90 | ||
| Indusind Bank Ltd. | 0.78 | ||
| Federal Bank Ltd. | 0.63 | ||
| Beverages | |||
| Varun Beverages Ltd. | 0.34 | ||
| United Spirits Ltd. | 0.00 | ||
| Capital Markets | |||
| HDFC Asset Management Company Ltd. | 0.20 | ||
| Cement & Cement Products | |||
| Ultratech Cement Ltd. | 0.65 | ||
| Ambuja Cements Ltd. | 0.62 | ||
| Grasim Industries Ltd. | 0.06 | ||
| ACC Ltd. | 0.00 | ||
| Construction | |||
| Larsen & Toubro Ltd. | 1.73 | ||
| Kec International Ltd. | 0.75 | ||
| Diversified Fmcg | |||
| ITC Ltd. | 0.72 | ||
| Hindustan Unilever Ltd. | 0.47 | ||
| Electrical Equipment | |||
| Siemens Ltd. | 0.46 | ||
| Abb India Ltd. | 0.20 | ||
| Waaree Energies Ltd. | 0.15 | ||
| Entertainment | |||
| Pvr Inox Ltd. | 0.21 | ||
| Ferrous Metals | |||
| Tata Steel Ltd. | 0.46 | ||
| Fertilizers & Agrochemicals | |||
| Pi Industries Ltd. | 0.60 | ||
| Finance | |||
| Bajaj Finance Ltd. | 1.10 | ||
| Bajaj Finserv Ltd. | 0.57 | ||
| Mahindra And Mahindra Financial Services Ltd. | 0.41 | ||
| Gas | |||
| Gail ( India ) Ltd. | 0.16 | ||
| Healthcare Services | |||
| Apollo Hospitals Enterprise Ltd. | 1.21 | ||
| Dr. Lal Path Labs Ltd. | 0.65 | ||
| It - Services | |||
| Inventurus Knowledge Solutions Ltd. | 0.48 | ||
| It - Software | |||
| Tata Consultancy Services Ltd. | 1.85 | ||
| Infosys Ltd. | 1.34 | ||
| HCL Technologies Ltd. | 0.76 | ||
| Tech Mahindra Ltd. | 0.43 | ||
| Industrial Products | |||
| Cummins India Ltd. | 0.90 | ||
| Insurance | |||
| HDFC Life Insurance Co. Ltd. | 0.77 | ||
| Niva Bupa Health Insurance Company Ltd. | 0.70 | ||
| ICICI Lombard General Insurance Co. Ltd. | 0.68 | ||
| ICICI Prudential Life Insurance Company Ltd. | 0.46 | ||
| Sbi Life Insurance Company Ltd. | 0.00 | ||
| Leisure Services | |||
| Indian Hotels Co. Ltd. | 0.43 | ||
| ITC Hotels Ltd. | 0.03 | ||
| Yatra Online Ltd. | 0.02 | ||
| Non - Ferrous Metals | |||
| Hindalco Industries Ltd. | 0.26 | ||
| Oil | |||
| Oil & Natural Gas Co. | 0.33 | ||
| Personal Products | |||
| Dabur India Ltd. | 0.43 | ||
| Petroleum Products | |||
| Reliance Industries Ltd. | 3.22 | ||
| Bharat Petroleum Corporation Ltd. | 0.63 | ||
| Pharmaceuticals & Biotechnology | |||
| Sun Pharmaceutical Industries Ltd. | 0.87 | ||
| Cipla Ltd. | 0.72 | ||
| Dr Reddys Laboratories Ltd. | 0.44 | ||
| Alkem Laboratories Ltd. | 0.42 | ||
| Power | |||
| NTPC Ltd. | 1.18 | ||
| Power Grid Corporation Of India Ltd. | 1.00 | ||
| Tata Power Company Ltd. | 0.49 | ||
| Realty | |||
| Godrej Properties Ltd. | 0.79 | ||
| Brookfield India Real Estate Trust | 0.73 | ||
| Nexus Select Trust | 0.63 | ||
| Dlf Ltd. | 0.53 | ||
| Retailing | |||
| Zomato Ltd. | 0.23 | ||
| Telecom - Services | |||
| Bharti Airtel Ltd. | 1.95 | ||
| Altius Telecom Infrastructure Trust | 0.77 | ||
| Indus Towers Ltd. | 0.34 | ||
| Transport Infrastructure | |||
| Adani Ports And Special Economic Zone Ltd. | 0.89 | ||
| Company Name | % to NAV | % to NAV Derivatives | |
| Hedge Positions | 16.47 | -16.55 | |
| State Bank Of India | 1.39 | ||
| State Bank Of India- Future | -1.40 | ||
| Hindalco Industries Ltd. | 0.99 | ||
| Hindalco Industries Ltd.- Future | -0.99 | ||
| Dlf Ltd. | 0.95 | ||
| Dlf Ltd.- Future | -0.95 | ||
| HDFC Bank Ltd. | 0.93 | ||
| HDFC Bank Ltd.- Future | -0.94 | ||
| Tata Consultancy Services Ltd. | 0.94 | ||
| Tata Consultancy Services Ltd.- Future | -0.94 | ||
| Infosys Ltd. | 0.90 | ||
| Infosys Ltd.- Future | -0.90 | ||
| Cipla Ltd. | 0.84 | ||
| Cipla Ltd.- Future | -0.85 | ||
| Hindustan Unilever Ltd. | 0.80 | ||
| Hindustan Unilever Ltd.- Future | -0.80 | ||
| Mahindra & Mahindra Ltd. | 0.77 | ||
| Mahindra & Mahindra Ltd.- Future | -0.78 | ||
| ICICI Bank Ltd. | 0.72 | ||
| ICICI Bank Ltd.- Future | -0.73 | ||
| Axis Bank Ltd. | 0.69 | ||
| Axis Bank Ltd.- Future | -0.70 | ||
| Upl Ltd. | 0.68 | ||
| Upl Ltd.- Future | -0.68 | ||
| Kotak Mahindra Bank Ltd. | 0.53 | ||
| Kotak Mahindra Bank Ltd.- Future | -0.53 | ||
| Polycab India Ltd. | 0.47 | ||
| Polycab India Ltd.- Future | -0.47 | ||
| Grasim Industries Ltd. | 0.44 | ||
| Grasim Industries Ltd.- Future | -0.44 | ||
| Reliance Industries Ltd. | 0.43 | ||
| Reliance Industries Ltd.- Future | -0.43 | ||
| United Spirits Ltd. | 0.43 | ||
| United Spirits Ltd.- Future | -0.43 | ||
| Wipro Ltd. | 0.40 | ||
| Wipro Ltd.- Future | -0.40 | ||
| Exide Industries Ltd. | 0.37 | ||
| Exide Industries Ltd.- Future | -0.37 | ||
| Tata Chemicals Ltd. | 0.36 | ||
| Tata Chemicals Ltd.- Future | -0.36 | ||
| Tech Mahindra Ltd. | 0.35 | ||
| Tech Mahindra Ltd.- Future | -0.36 | ||
| Sbi Life Insurance Company Ltd. | 0.34 | ||
| Sbi Life Insurance Company Ltd.- Future | -0.34 | ||
| ACC Ltd. | 0.31 | ||
| ACC Ltd.- Future | -0.31 | ||
| Multi Commodity Exchange Of Ind Ltd. | 0.24 | ||
| Multi Commodity Exchange Of Ind Ltd.- Future | -0.25 | ||
| Tata Power Company Ltd. | 0.25 | ||
| Tata Power Company Ltd.- Future | -0.25 | ||
| Larsen & Toubro Ltd. | 0.20 | ||
| Larsen & Toubro Ltd.- Future | -0.20 | ||
| Bajaj Auto Ltd. | 0.16 | ||
| Bajaj Auto Ltd.- Future | -0.16 | ||
| Abb India Ltd. | 0.15 | ||
| Abb India Ltd.- Future | -0.15 | ||
| Aarti Industries Ltd. | 0.12 | ||
| Aarti Industries Ltd.- Future | -0.12 | ||
| Gail ( India ) Ltd. | 0.12 | ||
| Gail ( India ) Ltd.- Future | -0.12 | ||
| Dr Reddys Laboratories Ltd. | 0.10 | ||
| Dr Reddys Laboratories Ltd.- Future | -0.10 | ||
| Federal Bank Ltd. | 0.05 | ||
| Federal Bank Ltd.- Future | -0.05 | ||
| Sun Pharmaceutical Industries Ltd. | 0.05 | ||
| Sun Pharmaceutical Industries Ltd.- Future | -0.05 | ||
| Name of the Instrument | Ratings | Market Value Rs. Lakhs | % to NAV |
| Debt Instruments | |||
| Government Securities | 138661.66 | 14.19 | |
| GOI - 7.34% (22/04/2064) | SOV | 26828.98 | 2.75 |
| GOI - 7.09% (05/08/2054) | SOV | 19886.90 | 2.04 |
| GOI - 5.63% (12/04/2026) | SOV | 15839.31 | 1.62 |
| GOI - 7.10% (08/04/2034) | SOV | 10213.50 | 1.05 |
| GOI - 5.74% (15/11/2026) | SOV | 7889.66 | 0.81 |
| GOI - 7.32% (13/11/2030) | SOV | 7720.64 | 0.79 |
| Sgs Tamilnadu 7.15% (22/01/2035) | SOV | 7505.02 | 0.77 |
| GOI - 5.22% (15/06/2025) | SOV | 6475.49 | 0.66 |
| GOI - 7.30% (19/06/2053) | SOV | 5106.96 | 0.52 |
| Sgs Maharashtra 7.32% (31/05/2032) | SOV | 5057.75 | 0.52 |
| Sgs Karnataka 7.42% (06/03/2035) | SOV | 4077.66 | 0.42 |
| GOI - 7.18% (14/08/2033) | SOV | 3586.03 | 0.37 |
| Sgs Karnataka 7.09% (16/10/2035) | SOV | 2489.59 | 0.26 |
| Sgs Andhra Pradesh 7.70% (06/12/2029) | SOV | 2576.02 | 0.26 |
| SDL Tamilnadu 6.53% (06/01/2031) | SOV | 2440.06 | 0.25 |
| GOI - 5.15% (09/11/2025) | SOV | 2475.96 | 0.25 |
| SDL Gujarat 8.53% (20/11/2028) | SOV | 2105.51 | 0.22 |
| Sgs Maharashtra 7.14% (05/02/2039) | SOV | 1496.10 | 0.15 |
| Sgs Tamilnadu 7.22% (15/01/2035) | SOV | 1005.55 | 0.10 |
| Sgs Karnataka 7.45% (20/03/2037) | SOV | 1019.97 | 0.10 |
| Sgs Gujarat 7.22% (15/01/2035) | SOV | 1005.48 | 0.10 |
| SDL Tamilnadu 6.95% (07/07/2031) | SOV | 497.80 | 0.05 |
| GOI - 6.97% (06/09/2026) | SOV | 502.82 | 0.05 |
| SDL Haryana 7.86% (27/12/2027) | SOV | 512.44 | 0.05 |
| Sgs Rajasthan 7.36% (24/07/2034) | SOV | 201.17 | 0.02 |
| Sgs Uttar Pradesh 7.49% (27/03/2036) | SOV | 124.64 | 0.01 |
| GOI - 5.77% (03/08/2030) | SOV | 1.63 | 0.00 |
| Sgs Karnataka 7.73% (03/01/2035) | SOV | 15.49 | 0.00 |
| Sgs Uttar Pradesh 7.70% (22/11/2035) | SOV | 3.53 | 0.00 |
| Non-Convertible Debentures/Bonds/Zcb | 76490.65 | 7.83 | |
| 07.24 % Power Finance Corporation | CRISIL AAA | 7427.57 | 0.76 |
| 07.85 % Interise Trust | ICRA AAA | 5764.72 | 0.59 |
| 07.58 % Rec Ltd. | CRISIL AAA | 5018.19 | 0.51 |
| 07.84 % Tata Capital Housing Finance Ltd. | CRISIL AAA | 5005.44 | 0.51 |
| 07.40 % Nabard | CRISIL AAA | 4988.12 | 0.51 |
| 07.59 % Power Finance Corporation | CRISIL AAA | 5018.23 | 0.51 |
| 05.81 % Rec Ltd. | CRISIL AAA | 4921.75 | 0.50 |
| 07.74 % LIC Housing Finance Ltd. | CRISIL AAA | 4507.45 | 0.46 |
| 08.30 % Rec Ltd. | CRISIL AAA | 3432.13 | 0.35 |
| 08.30 % Godrej Properties Ltd. | ICRA AA+ | 2504.73 | 0.26 |
| 07.68 % LIC Housing Finance Ltd. | CRISIL AAA | 2518.97 | 0.26 |
| 07.73 % LIC Housing Finance Ltd. | CRISIL AAA | 2525.18 | 0.26 |
| 07.53 % Nabard | CRISIL AAA | 2502.96 | 0.26 |
| 08.20 % Cholamandalam Invt & Fin Co Ltd. | ICRA AA+ | 2499.53 | 0.26 |
| 08.92 % Cholamandalam Invt & Fin Co Ltd. | ICRA AA+ | 2488.83 | 0.26 |
| 07.10 % Rec Ltd. | CRISIL AAA | 2449.02 | 0.25 |
| 07.20 % Rec Ltd. | CRISIL AAA | 2465.84 | 0.25 |
| L&T Finance Ltd. - Zcb | CRISIL AAA | 2430.01 | 0.25 |
| 07.70 % Rec Ltd. | CRISIL AAA | 2000.46 | 0.21 |
| 08.52 % LIC Housing Finance Ltd. | CRISIL AAA | 1500.06 | 0.15 |
| 08.94 % Truhome Finance Ltd. | CRISIL AA | 1499.30 | 0.15 |
| 07.80 % Bajaj Finance Ltd. | CRISIL AAA | 1000.20 | 0.10 |
| 08.43 % HDFC Bank Ltd. | ICRA AAA | 500.02 | 0.05 |
| 07.22 % Tata Capital Ltd. | CRISIL AAA | 497.89 | 0.05 |
| 07.13 % Nhpc Ltd. | ICRA AAA | 498.53 | 0.05 |
| LIC Housing Finance Ltd. - Zcb | CRISIL AAA | 252.58 | 0.03 |
| 07.14 % Exim | CRISIL AAA | 272.94 | 0.03 |
| Securitised Debt Privately Placed/ Unlisted | 15295.46 | 1.57 | |
| 08.85 % Sansar June 2024 Trust | CRISIL AAA(SO) | 8750.00 | 0.90 |
| 08.20 % India Universal Trust Al1 | IND AAA(SO) | 4490.81 | 0.46 |
| 08.03 % India Universal Trust Al2 | CRISIL AAA(SO) | 1361.53 | 0.14 |
| 08.17 % India Universal Trust Al2 | CRISIL AAA(SO) | 693.12 | 0.07 |
| Money Market Instruments | 9445.57 | 0.96 | |
| Punjab National Bank - CD | CRISIL A1+ | 4719.91 | 0.48 |
| Canara Bank - CD | CRISIL A1+ | 4725.66 | 0.48 |
| Name of the Instrument | Units | Market Value Rs. Lakhs | % to NAV |
| Mutual Fund Units Related | 8424.15 | 0.87 | |
| Mutual Fund Units | |||
| Tata Corporate Bond Fund | 42248314.31 | 5149.22 | 0.53 |
| Tata Nifty G-Sec Dec 2026 Index Fund | 14999250.04 | 1749.75 | 0.18 |
| Tata Fixed Maturity Plan Series 61 Scheme D (91 Days) | 14999250.04 | 1525.18 | 0.16 |
| Repo | 44273.72 | 4.54 | |
| Portfolio Total | 955487.58 | 97.89 | |
| Cash / Net Current Asset | 19956.80 | 2.11 | |
| Net Assets | 975444.38 | 100.00 | |
| Issuer Name | % to NAV |
| HDFC Bank Ltd. | 4.80 |
| Reliance Industries Ltd. | 3.65 |
| ICICI Bank Ltd. | 3.55 |
| Tata Consultancy Services Ltd. | 2.79 |
| State Bank Of India | 2.46 |
| Infosys Ltd. | 2.23 |
| Mahindra & Mahindra Ltd. | 1.97 |
| Bharti Airtel Ltd. | 1.95 |
| Larsen & Toubro Ltd. | 1.92 |
| Axis Bank Ltd. | 1.77 |
| Total | 27.09 |
| Large Cap | 80.90% |
| Mid Cap | 13.77% |
| Small Cap | 5.34% |
| Market Capitalisation is as per list provided by AMFI. | |