| Tata Gilt Securities Fund
(An open ended debt scheme investing predominantly |
 |
As on 28th February 2025


|
INVESTMENT STYLE:
MINIMUM INVESTMENT/
MULTIPLES FOR NEW INVESTMENT:
MULTIPLES FOR EXISTING INVESTORS:
Please refer to our Tata Mutual Fund website for fundamental changes, wherever applicable
A debt scheme that invests in Government securities to generate reasonable returns emphasising the importance of captial preservation.
INVESTMENT OBJECTIVE:The investment objective of the Scheme is to generate medium to long term capital appreciation and income distribution by investing predominantly in Government Securities.
DATE OF ALLOTMENT:September 6, 1999
FUND MANAGER(S)Akhil Mittal (Managing Since 01-Mar-22 and overall experience of 23 years)
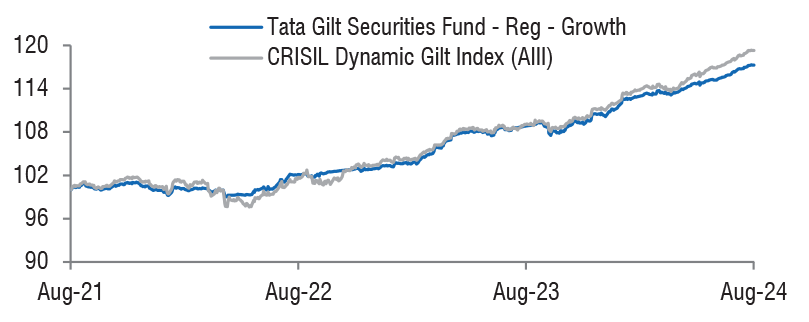
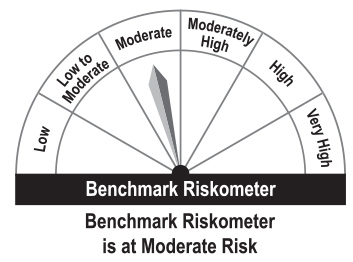
BENCHMARK:CRISIL Dynamic Gilt Index (AIII)
NAV (in Rs.)| Direct - Growth | : 83.7034 |
| Direct - IDCW | : 23.5683 |
| Reg -Growth | : 75.0477 |
| Reg -IDCW | : 20.8036 |
| FUND SIZE | |
| Rs. 1070.87 (Rs. in Cr.) | |
| MONTHLY AVERAGE AUM | |
| Rs. 1070.96 (Rs. in Cr.) | |
| EXPENSE RATIO** | |
| Direct | 0.29 |
| Regular | 1.39 |
| **Note: The rates specified are actual month end expenses charged as on Feb 28, 2025. The above ratio includes the GST on Investment Management Fees. The above ratio excludes, borrowing cost, wherever applicable. | |
| VOLATILITY MEASURES^ | FUND | BENCHMARK |
| Std. Dev (Annualised) | 2.06 | 2.75 |
| Portfolio Beta | 0.63 | NA |
| R Squared | 0.74 | NA |
| Treynor | -0.04 | NA |
| Jenson | -0.04 | NA |
| Portfolio Macaulay Duration | : | 10.78 Years |
| Modified Duration | : | 10.42 Years |
| Average Maturity | : | 25.54 Years |
| Annualized Yield to Maturity (For Debt Component)* | ||
| - Including Net Current Assets | : | 7.14% |
| *Computed on the invested amount for debt portfolio | ||
| ^Risk-free rate based on the FBIL Overnight MIBOR rate
of 6.4% as on Feb 28, 2025 For calculation methodology | ||
MULTIPLES FOR NEW INVESTMENT:
Rs. 5,000/- and in multiples of Re. 1/- thereafter.
ADDITIONAL INVESTMENT/MULTIPLES FOR EXISTING INVESTORS:
Rs. 1,000/- and multiples of Re. 1/- thereafter.
LOAD STRUCTURE:| ENTRY LOAD | Not Applicable |
| EXIT LOAD |
Nil (w.e.f. 2nd November, 2018) |
Please refer to our Tata Mutual Fund website for fundamental changes, wherever applicable
| Name of the Instrument | Ratings | Market Value Rs Lakhs | % to NAV |
| Debt Instruments | |||
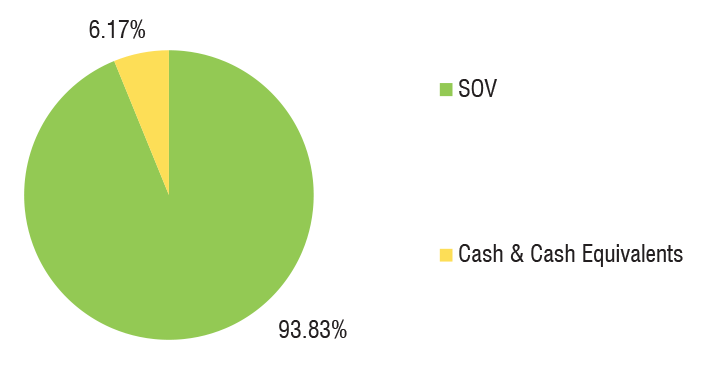
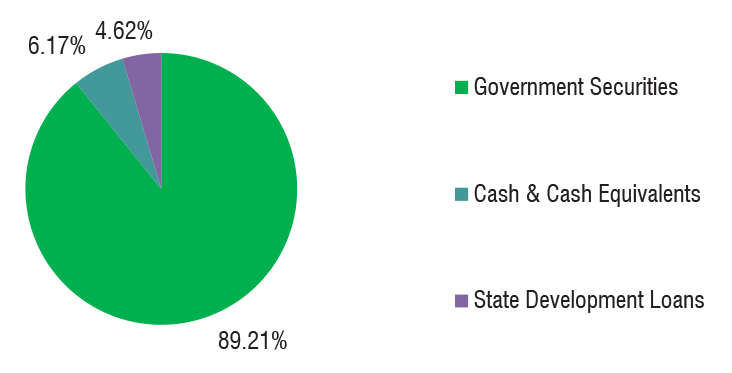
| Government Securities | 104336.69 | 97.43 | |
| GOI - 7.34% (22/04/2064) | SOV | 32446.08 | 30.30 |
| GOI - 7.09% (05/08/2054) | SOV | 28968.65 | 27.05 |
| GOI - 7.23% (15/04/2039) | SOV | 10281.53 | 9.60 |
| GOI - 6.92% (18/11/2039) | SOV | 10016.22 | 9.35 |
| GOI - 6.54% (17/01/2032) | SOV | 9885.28 | 9.23 |
| GOI - 6.79% (07/10/2034) | SOV | 7534.45 | 7.04 |
| GOI - 7.18% (14/08/2033) | SOV | 2561.45 | 2.39 |
| GOI - 7.46% (06/11/2073) | SOV | 2080.60 | 1.94 |
| Sgs Tamilnadu 7.15% (22/01/2035) | SOV | 500.33 | 0.47 |
| Sgs Tamilnadu 7.49% (24/04/2034) | SOV | 62.10 | 0.06 |
| Repo | 1088.07 | 1.02 | |
| Portfolio Total | 105424.76 | 98.45 | |
| Cash / Net Current Asset | 1662.43 | 1.55 | |
| Net Assets | 107087.19 | 100.00 | |
