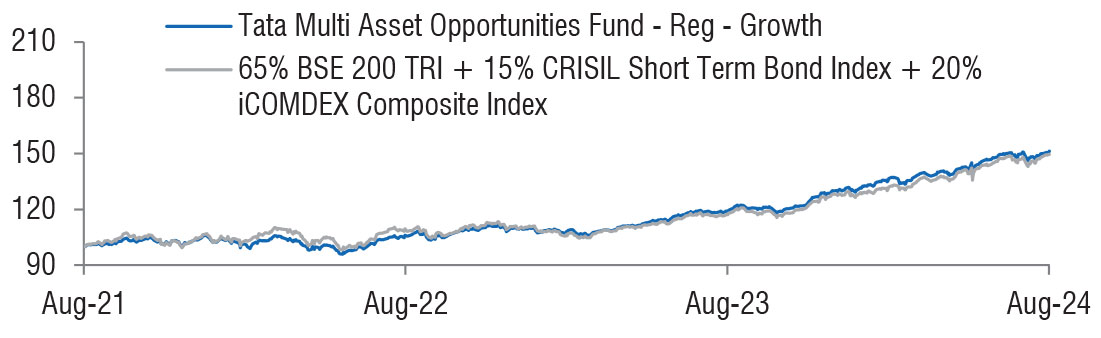
| Tata Multi Asset Opportunities Fund
(An Open Ended Scheme investing in equity, debt & exchange traded commodity derivatives) |
As on 28th February 2025


|
Fund invests in a mix of equity and equity related instruments, Fixed Income and Commodities & Exchange traded Commodity derivatives.
INVESTMENT OBJECTIVE:The investment objective of the scheme is to generate long term capital appreciation. However, there is no assurance or guarantee that the investment objective of the Scheme will be achieved. The scheme does not assure or guarantee any returns.
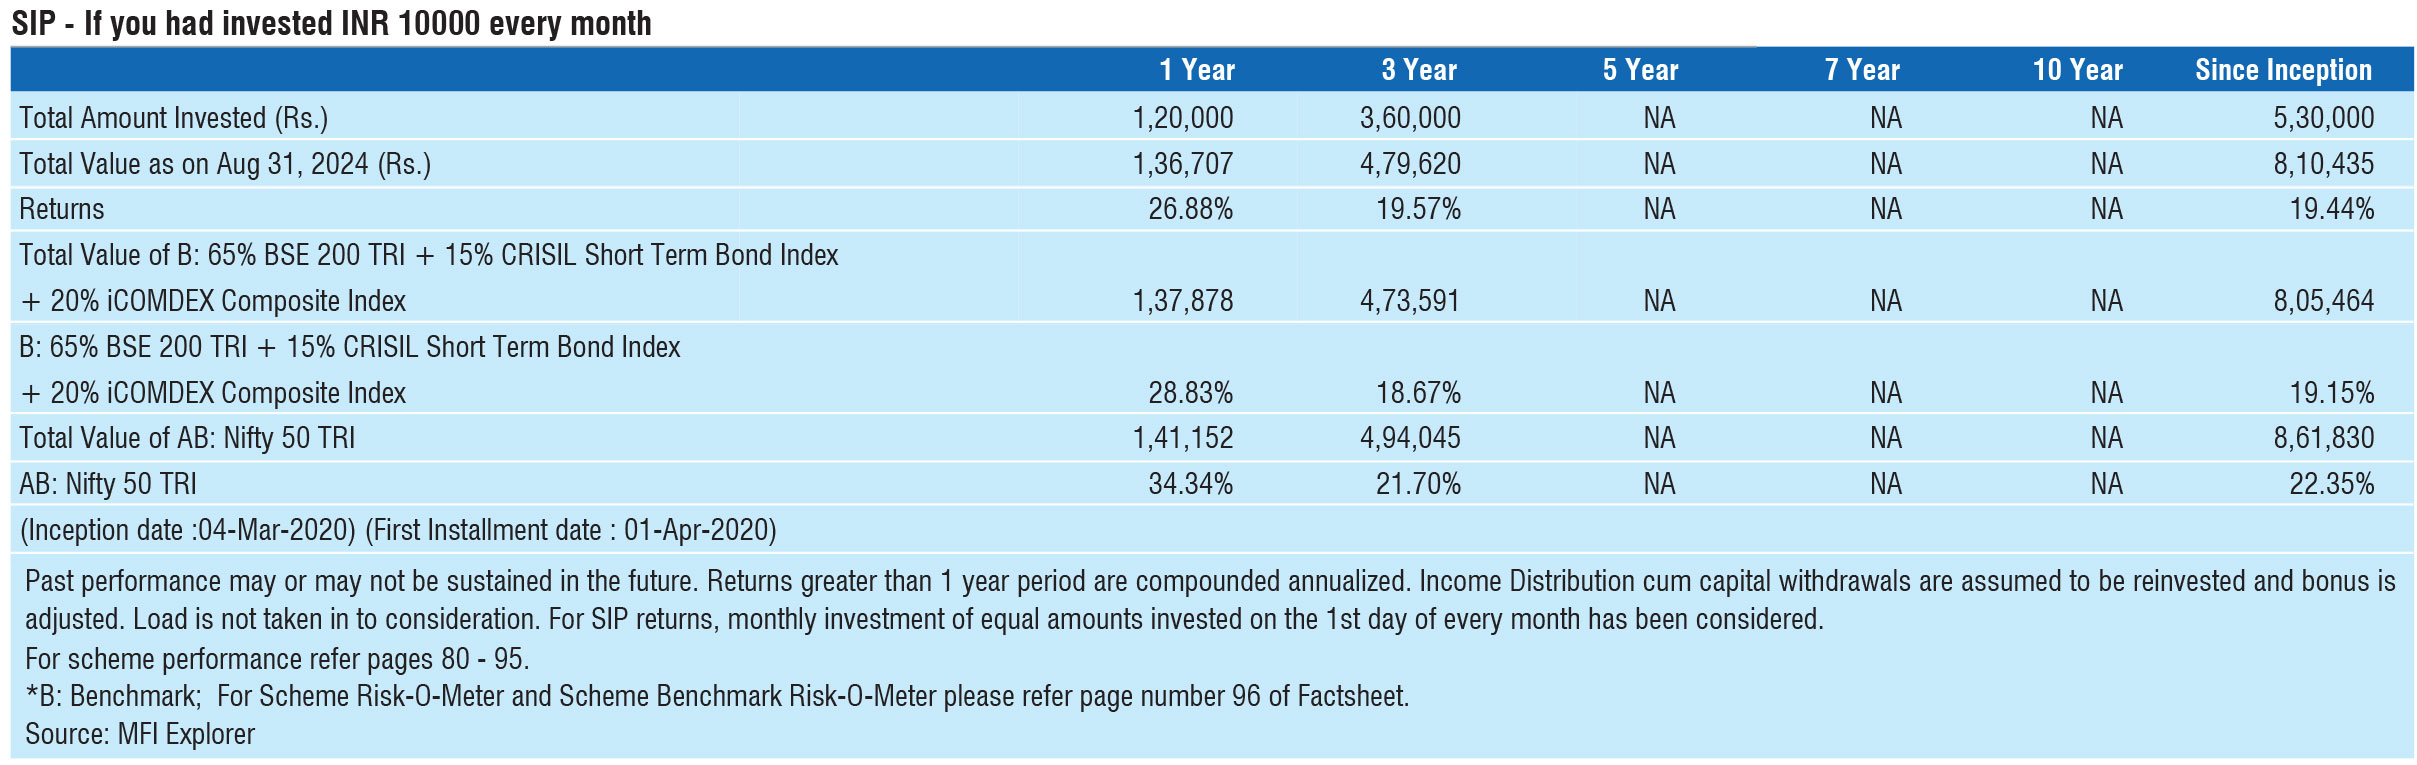
DATE OF ALLOTMENT:March 04, 2020
FUND MANAGER(S)Rahul Singh (Managing Since 04-Mar-20 and overall experience of 29 years),
Sailesh Jain (Managing Since 04-Mar-20 and overall experience of 22 years),
Murthy Nagarajan (Managing Since 02-Feb-23 and overall experience of 28 years),
Tapan Patel (Managing Since 16-Aug-23 and overall experience of 11 years)
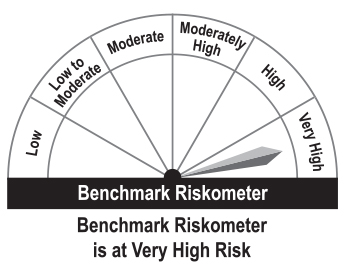
65% BSE 200 TRI + 15% CRISIL Short Term Bond Index + 20% iCOMDEX Composite Index
NAV (in Rs.)| Direct - IDCW | : 22.6449 |
| Direct - Growth | : 22.6449 |
| Regular - IDCW | : 20.7962 |
| Regular - Growth | : 20.7962 |
| FUND SIZE | |
| Rs.3337.44 (Rs. in Cr.) | |
| MONTHLY AVERAGE AUM | |
| Rs.3439.24 (Rs. in Cr.) | |
| TURN OVER | |
| Portfolio Turnover (Equity component only) | 17.87% |
| EXPENSE RATIO** | |
| Direct | 0.49 |
| Regular | 1.87 |
| **Note: The rates specified are actual month end expenses charged as on Feb 28, 2025. The above ratio includes the GST on Investment Management Fees. The above ratio excludes, borrowing cost, wherever applicable. | |
| VOLATILITY MEASURES^ | FUND | BENCHMARK |
| Std. Dev (Annualised) | 8.39 | 10.03 |
| Sharpe Ratio | 0.53 | 0.38 |
| Portfolio Beta | 0.77 | NA |
| R Squared | 0.90 | NA |
| Treynor | 0.49 | NA |
| Jenson | 0.12 | NA |
| Portfolio Macaulay Duration | : | 4.14 Years |
| Modified Duration | : | 3.99 Years |
| Average Maturity | : | 8.4 Years |
| Annualized Yield to Maturity (For Debt Component)* | ||
| - Including Net Current Assets | : | 7.19% |
| *Computed on the invested amount for debt portfolio | ||
| Total stock in Portfolio | : | 72 |
| ^Risk-free rate based on the FBIL Overnight MIBOR rate of 6.4% as
on Feb 28, 2025 For calculation methodology | ||
MULTIPLES FOR NEW INVESTMENT:
Growth option: Rs 5,000/- and in multiple of Re.1/- thereafter
IDCW (payout): Rs 5,000/- and in multiple of Re.1/- thereafter
MULTIPLES FOR EXISTING INVESTORS:
Rs.1000/-& in multiples of Re.1/-thereafter.
LOAD STRUCTURE:| ENTRY LOAD | Not Applicable |
| EXIT LOAD |
• Exit Load is Nil, if the withdrawal amount or switched out amount is
not more than 12% of the original cost of investment on or before
expiry of 365 days from the date of allotment. • Exit load is 1% of the applicable NAV if the withdrawal amount or switched out amount is more than 12% of the original cost of investment on or before expiry of 365 days from the date of allotment. • No Exit load will be charged for redemption or switch out after expiry of 365 days from the date of allotment |
Please refer to our Tata Mutual Fund website for fundamental changes, wherever applicable
| Company name | No. of Shares | Market Value Rs Lakhs | % of Assets |
| Equity & Equity Related Total | 217930.07 | 65.23 | |
| Unhedge Positions | 55.57 | ||
| Automobiles | |||
| Mahindra & Mahindra Ltd. | 157000 | 4058.61 | 1.22 |
| Hero Motocorp Ltd. | 93750 | 3451.03 | 1.03 |
| Tata Motors Ltd. | 187025 | 1160.77 | 0.35 |
| Banks | |||
| HDFC Bank Ltd. | 835114 | 14467.51 | 4.33 |
| ICICI Bank Ltd. | 786075 | 9465.13 | 2.84 |
| State Bank Of India | 807000 | 5558.62 | 1.67 |
| Axis Bank Ltd. | 506900 | 5147.82 | 1.54 |
| Rbl Bank Ltd. | 1513083 | 2395.82 | 0.72 |
| Bank Of Baroda | 945000 | 1862.31 | 0.56 |
| Federal Bank Ltd. | 902821 | 1603.59 | 0.48 |
| Indusind Bank Ltd. | 135338 | 1339.98 | 0.40 |
| Capital Markets | |||
| HDFC Asset Management Company Ltd. | 40500 | 1469.46 | 0.44 |
| Cement & Cement Products | |||
| Ultratech Cement Ltd. | 26900 | 2724.55 | 0.82 |
| Ambuja Cements Ltd. | 468748 | 2179.44 | 0.65 |
| The Ramco Cements Ltd. | 239177 | 1982.78 | 0.59 |
| ACC Ltd. | 200 | 3.64 | 0.00 |
| Construction | |||
| Larsen & Toubro Ltd. | 142473 | 4507.63 | 1.35 |
| Kec International Ltd. | 512760 | 3519.84 | 1.05 |
| Afcons Infrastructure Ltd. | 607550 | 2509.79 | 0.75 |
| H.G. Infra Engineering Ltd. | 159600 | 1539.18 | 0.46 |
| Diversified Fmcg | |||
| Hindustan Unilever Ltd. | 80400 | 1760.96 | 0.53 |
| ITC Ltd. | 382600 | 1511.27 | 0.45 |
| Electrical Equipment | |||
| Thermax Ltd. | 49371 | 1603.82 | 0.48 |
| Entertainment | |||
| Pvr Inox Ltd. | 92564 | 836.73 | 0.25 |
| Fertilizers & Agrochemicals | |||
| Paradeep Phosphates Ltd. | 2858100 | 2483.40 | 0.74 |
| Pi Industries Ltd. | 67689 | 2040.11 | 0.61 |
| Finance | |||
| Bajaj Finance Ltd. | 35250 | 3006.93 | 0.90 |
| Five-Star Business Finance Ltd. | 240479 | 1831.25 | 0.55 |
| India Shelter Finance Corporation Ltd. | 220000 | 1599.40 | 0.48 |
| Financial Technology (Fintech) | |||
| Pb Fintech Ltd. | 150000 | 2195.40 | 0.66 |
| Gas | |||
| Gail ( India ) Ltd. | 1175000 | 1833.47 | 0.55 |
| Healthcare Services | |||
| Dr. Agarwals Health Care Ltd. | 1020656 | 4092.83 | 1.23 |
| Dr. Lal Path Labs Ltd. | 102250 | 2362.44 | 0.71 |
| Apollo Hospitals Enterprise Ltd. | 38949 | 2357.43 | 0.71 |
| It - Software | |||
| Infosys Ltd. | 293400 | 4951.71 | 1.48 |
| Tata Consultancy Services Ltd. | 123425 | 4299.20 | 1.29 |
| Tech Mahindra Ltd. | 168000 | 2499.59 | 0.75 |
| HCL Technologies Ltd. | 136100 | 2143.64 | 0.64 |
| Industrial Manufacturing | |||
| Tega Industries Ltd. | 156462 | 2069.76 | 0.62 |
| Industrial Products | |||
| Cummins India Ltd. | 109622 | 2979.47 | 0.89 |
| R R Kabel Ltd. | 117571 | 1046.68 | 0.31 |
| Insurance | |||
| HDFC Life Insurance Co. Ltd. | 428558 | 2607.78 | 0.78 |
| ICICI Lombard General Insurance Co. Ltd. | 121000 | 2046.05 | 0.61 |
| ICICI Prudential Life Insurance Company Ltd. | 326000 | 1798.22 | 0.54 |
| Niva Bupa Health Insurance Company Ltd. | 2444074 | 1783.44 | 0.53 |
| Leisure Services | |||
| Le Travenues Technology Ltd. | 1612903 | 2159.35 | 0.65 |
| Juniper Hotels Ltd. | 192093 | 483.69 | 0.14 |
| ITC Hotels Ltd. | 38260 | 62.67 | 0.02 |
| Non - Ferrous Metals | |||
| Hindalco Industries Ltd. | 1300 | 8.25 | 0.00 |
| Petroleum Products | |||
| Reliance Industries Ltd. | 1152852 | 13835.38 | 4.15 |
| Bharat Petroleum Corporation Ltd. | 800000 | 1898.40 | 0.57 |
| Pharmaceuticals & Biotechnology | |||
| Sun Pharmaceutical Industries Ltd. | 155000 | 2469.54 | 0.74 |
| Wockhardt Ltd. | 174908 | 2021.06 | 0.61 |
| Aurobindo Pharma Ltd. | 178583 | 1889.94 | 0.57 |
| Orchid Pharma Ltd. | 138130 | 1327.50 | 0.40 |
| Dr Reddys Laboratories Ltd. | 110750 | 1236.52 | 0.37 |
| Cipla Ltd. | 45250 | 636.89 | 0.19 |
| Power | |||
| Power Grid Corporation Of India Ltd. | 1499888 | 3762.47 | 1.13 |
| NTPC Ltd. | 1140000 | 3550.53 | 1.06 |
| Adani Energy Solutions Ltd. | 205932 | 1340.41 | 0.40 |
| Realty | |||
| Dlf Ltd. | 469375 | 2983.11 | 0.89 |
| Brigade Enterprises Ltd. | 227102 | 2150.77 | 0.64 |
| Godrej Properties Ltd. | 90000 | 1742.67 | 0.52 |
| Telecom - Services | |||
| Bharti Airtel Ltd. | 503826 | 7911.08 | 2.37 |
| Textiles & Apparels | |||
| Ganesha Ecosphere Ltd. | 90000 | 1181.16 | 0.35 |
| Transport Infrastructure | |||
| Adani Ports And Special Economic Zone Ltd. | 326100 | 3487.31 | 1.04 |
| Transport Services | |||
| Spicejet Ltd. | 1623376 | 745.29 | 0.22 |
| Company Name | % to NAV | % to NAV Derivatives | |
| Hedge Positions | 9.66 | -9.69 | |
| Upl Ltd. | 1.27 | ||
| Upl Ltd.- Future | -1.27 | ||
| ICICI Bank Ltd. | 1.22 | ||
| ICICI Bank Ltd.- Future | -1.23 | ||
| Indus Towers Ltd. | 1.15 | ||
| Indus Towers Ltd.- Future | -1.15 | ||
| Larsen & Toubro Ltd. | 1.03 | ||
| Larsen & Toubro Ltd.- Future | -1.03 | ||
| Cipla Ltd. | 0.98 | ||
| Cipla Ltd.- Future | -0.99 | ||
| HDFC Bank Ltd. | 0.97 | ||
| HDFC Bank Ltd.- Future | -0.98 | ||
| State Bank Of India | 0.70 | ||
| State Bank Of India- Future | -0.70 | ||
| Axis Bank Ltd. | 0.66 | ||
| Axis Bank Ltd.- Future | -0.66 | ||
| Titan Company Ltd. | 0.63 | ||
| Titan Company Ltd.- Future | -0.63 | ||
| Exide Industries Ltd. | 0.54 | ||
| Exide Industries Ltd.- Future | -0.54 | ||
| Ultratech Cement Ltd. | 0.41 | ||
| Ultratech Cement Ltd.- Future | -0.41 | ||
| Bajaj Auto Ltd. | 0.10 | ||
| Bajaj Auto Ltd.- Future | -0.10 | ||
| Company Name | No. of Shares | Market Value Rs. Lakhs | % of Assets |
| COMMODITIES & COMMODITIES RELATED | |||
| COMMODITIES PHYSICAL | 56883.82 | 17.05 | |
| SILVER (30 K COMMODITY | 27210 | 25250.56 | 7.57 |
| SILVER MINI (5 KGS) COMMODITY | 7130 | 6737.78 | 2.02 |
| LEAD (5 MT 5000 GMS) COMMODITY | 750000 | 1398.38 | 0.42 |
| LISTED ON COMMODITY EXCHANGE (Quantity In Lots) | |||
| GOLD (1 KG-1000 GMS) COMMODITY^ | 27900 | 23497.10 | 7.04 |
| LEAD (5 MT 5000 GMS) COMMODITY^ | -750000 | -1353.00 | -0.41 |
| SILVER MINI (5 KGS) COMMODITY^ | -7130 | -6731.58 | -2.02 |
| SILVER (30 K COMMODITY^ | -27210 | -25666.65 | -7.69 |
| Name of the Instrument | Ratings | Market Value Rs. Lakhs | % to NAV |
| Debt Instruments | |||
| Government Securities | 36933.88 | 11.06 | |
| GOI - 7.34% (22/04/2064) | SOV | 10757.00 | 3.22 |
| GOI - 7.10% (08/04/2034) | SOV | 7660.13 | 2.30 |
| GOI - 7.18% (14/08/2033) | SOV | 4610.61 | 1.38 |
| GOI - 6.79% (07/10/2034) | SOV | 3013.78 | 0.90 |
| GOI - 5.63% (12/04/2026) | SOV | 2474.89 | 0.74 |
| GOI - 7.26% (06/02/2033) | SOV | 2058.07 | 0.62 |
| GOI - 7.27% (08/04/2026) | SOV | 1812.69 | 0.54 |
| GOI - 7.02% (18/06/2031) | SOV | 1362.65 | 0.41 |
| Sgs Tamilnadu 7.44% (05/06/2034) | SOV | 889.76 | 0.27 |
| GOI - 7.18% (24/07/2037) | SOV | 559.78 | 0.17 |
| Sgs Maharashtra 7.49% (07/02/2036) | SOV | 465.35 | 0.14 |
| Sgs West Bengal 7.48% (14/02/2043) | SOV | 411.50 | 0.12 |
| Sgs Uttar Pradesh 7.46% (22/03/2039) | SOV | 337.89 | 0.10 |
| Sgs Maharashtra 7.48% (07/02/2035) | SOV | 174.21 | 0.05 |
| Sgs Maharashtra 7.63% (31/01/2036) | SOV | 158.29 | 0.05 |
| Sgs Maharashtra 7.63% (31/01/2035) | SOV | 111.04 | 0.03 |
| GOI - 5.77% (03/08/2030) | SOV | 76.24 | 0.02 |
| Non-Convertible Debentures/Bonds | 10464.51 | 3.13 | |
| 08.75 % Bharti Telecom Ltd. | CRISIL AA+ | 2536.55 | 0.76 |
| 07.45 % Exim | CRISIL AAA | 2511.35 | 0.75 |
| 07.45 % Rec Ltd. | CRISIL AAA | 2505.47 | 0.75 |
| 07.85 % Interise Trust | ICRA AAA | 2401.97 | 0.72 |
| 07.80 % HDFC Bank Ltd. | CRISIL AAA | 509.17 | 0.15 |
| Name of the Instrument | Units | Market Value Rs. Lakhs | % to NAV |
| Mutual Fund Units Related | 2844.50 | 0.85 | |
| Mutual Fund Units | |||
| Tata Treasury Advantage Fund | 72434.117 | 2844.50 | 0.85 |
| Repo | 20937.57 | 6.27 | |
| Portfolio Total | 345832.74 | 103.58 | |
| Net Current Liabilities | -12088.62 | -3.58 | |
| Net Assets | 333744.12 | 100.00 | |
| Issuer Name | % to NAV |
| HDFC Bank Ltd. | 5.31 |
| Reliance Industries Ltd. | 4.15 |
| ICICI Bank Ltd. | 4.06 |
| Larsen & Toubro Ltd. | 2.38 |
| Bharti Airtel Ltd. | 2.37 |
| State Bank Of India | 2.36 |
| Axis Bank Ltd. | 2.20 |
| Infosys Ltd. | 1.48 |
| Tata Consultancy Services Ltd. | 1.29 |
| Upl Ltd. | 1.27 |
| Total | 26.87 |
| Large Cap | 70.40% |
| Mid Cap | 11.21% |
| Small Cap | 18.40% |
| Market Capitalisation is as per list provided by AMFI. | |