| Tata Retirement Savings Fund - Progressive Plan
(An open ended retirement solution oriented scheme having a lock-in of 5 years or till retirement age (whichever is earlier)) |
 |
As on 28th February 2025


|
A Fund that aims to provide an investment tool for retirement planning to suit the risk profile of the investor.
INVESTMENT OBJECTIVE:To provide a financial planning tool for long term financial security for investors based on their retirement planning goals. However, there can be no assurance that the investment objective of the fund will be realized, as actual market movements may be at variance with anticipated trends.
DATE OF ALLOTMENT:November 1, 2011
FUND MANAGER(S)Sonam Udasi (Managing Since 01-Apr-16 and overall Sonam Udasi (Managing Since 01-Apr-16 and overall experience of 27 years) (Equity) & Murthy Nagarajan (Managing since 01-Apr-17 and overall experience of 28 years) (Debt)
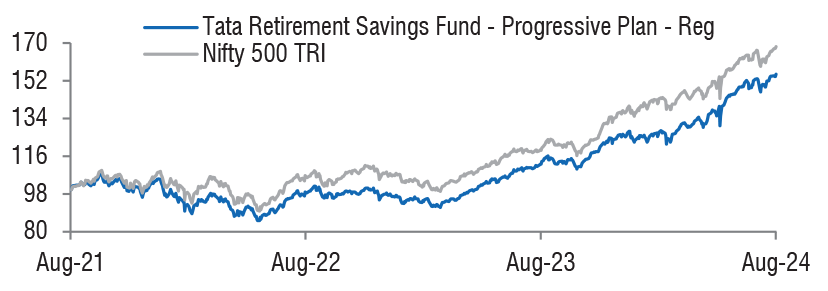
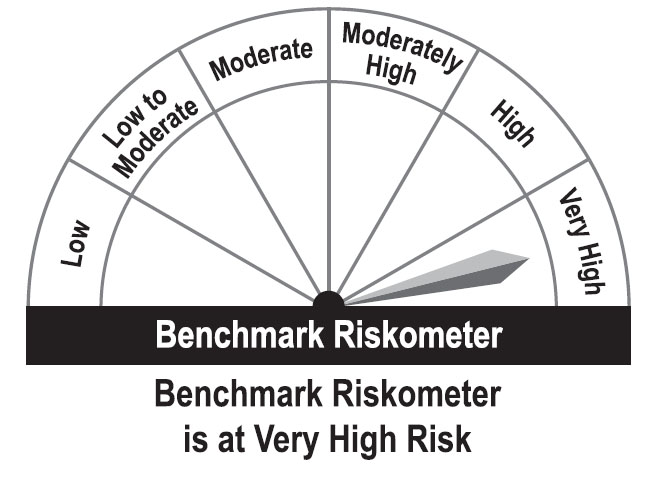
BENCHMARK:Nifty 500 TRI
NAV (in Rs.)| Direct - Growth | : 67.7617 |
| Reg - Growth | : 56.1143 |
| FUND SIZE | |
| Rs. 1803.24 (Rs. in Cr.) | |
| MONTHLY AVERAGE AUM | |
| Rs. 1912.05 (Rs. in Cr.) | |
| TURN OVER | |
| Portfolio Turnover (Equity component only) | 61.44% |
| EXPENSE RATIO** | |
| Direct | 0.59 |
| Regular | 2.06 |
| **Note: The rates specified are actual month end expenses charged as on Feb 28, 2025. The above ratio includes the GST on Investment Management Fees. The above ratio excludes, borrowing cost, wherever applicable. | |
| VOLATILITY MEASURES^ | FUND | BENCHMARK |
| Std. Dev (Annualised) | 13.49 | 14.47 |
| Sharpe Ratio | 0.42 | 0.46 |
| Portfolio Beta | 0.85 | NA |
| R Squared | 0.87 | NA |
| Treynor | 0.57 | NA |
| Jenson | 0.01 | NA |
| ^Risk-free rate based on the FBIL Overnight MIBOR rate of 6.4% as
on Feb 28, 2025 For calculation methodology | ||
MULTIPLES FOR NEW INVESTMENT:
Rs. 5,000/- and in multiples of Re. 1/- thereafter.
ADDITIONAL INVESTMENT/MULTIPLES FOR EXISTING INVESTORS:
Rs. 1,000/- and multiples of Re. 1/- thereafter
LOAD STRUCTURE:| ENTRY LOAD | Not Applicable |
| EXIT LOAD |
1) Nil – If redemption or switch out on or after
attainment of retirement age i.e. 60years. 2) Nil – In case of Auto switch out of units on occurrence of Auto switch trigger event. 3) Exit Load is 1% – If redeemed before 61 months from the date of allotment. The above condtions applicable (w.e.f. 3rd May, 2019) |
Please refer to our Tata Mutual Fund website for fundamental changes, wherever applicable
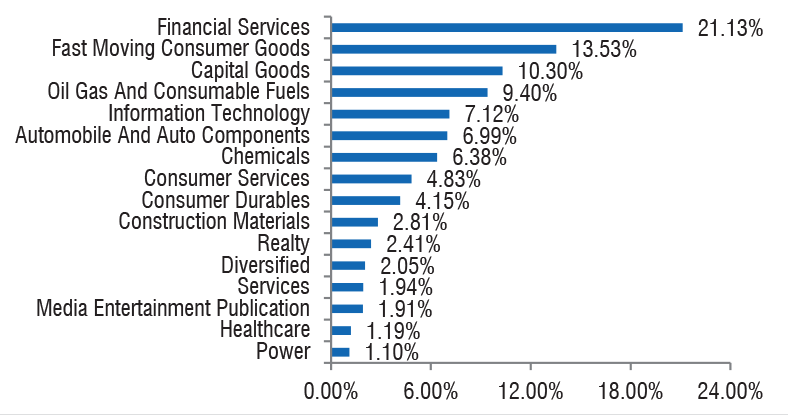
| Company name | No. of Shares | Market Value Rs Lakhs | % to NAV |
| Equity & Equity Related Total | 162072.13 | 89.87 | |
| Agricultural Food & Other Products | |||
| Tata Consumer Products Ltd. | 305000 | 2939.29 | 1.63 |
| Auto Components | |||
| Pricol Ltd. | 426000 | 1694.84 | 0.94 |
| Automobiles | |||
| Maruti Suzuki India Ltd. | 17100 | 2042.74 | 1.13 |
| Hero Motocorp Ltd. | 42600 | 1568.15 | 0.87 |
| Banks | |||
| HDFC Bank Ltd. | 754000 | 13062.30 | 7.24 |
| Karur Vysya Bank Ltd. | 1836000 | 3692.38 | 2.05 |
| ICICI Bank Ltd. | 300000 | 3612.30 | 2.00 |
| Beverages | |||
| Radico Khaitan Ltd. | 249600 | 5174.33 | 2.87 |
| United Spirits Ltd. | 141781 | 1821.11 | 1.01 |
| Capital Markets | |||
| Bse Ltd. | 117000 | 5421.43 | 3.01 |
| Nippon Life India Asset Management Ltd. | 459000 | 2356.05 | 1.31 |
| 360 One Wam Ltd. | 208666 | 2083.11 | 1.16 |
| Uti Asset Management Company Ltd. | 200600 | 1887.45 | 1.05 |
| Cement & Cement Products | |||
| Nuvoco Vistas Corporation Ltd. (Nirma Group) | 894532 | 2803.91 | 1.55 |
| Chemicals & Petrochemicals | |||
| Solar Industries India Ltd. | 64035 | 5577.83 | 3.09 |
| Fine Organic Industries Ltd. | 40364 | 1414.01 | 0.78 |
| Consumer Durables | |||
| Metro Brands Ltd. | 285168 | 3185.75 | 1.77 |
| Dixon Technologies (India) Ltd. | 20089 | 2799.57 | 1.55 |
| Campus Activewear Ltd. | 720000 | 1876.68 | 1.04 |
| Diversified | |||
| Godrej Industries Ltd. | 247525 | 2716.83 | 1.51 |
| Diversified Fmcg | |||
| ITC Ltd. | 1853000 | 7319.35 | 4.06 |
| Electrical Equipment | |||
| Voltamp Transformers Ltd. | 17010 | 1067.89 | 0.59 |
| Entertainment | |||
| Saregama India Ltd. | 451960 | 2005.57 | 1.11 |
| Fertilizers & Agrochemicals | |||
| Astec Lifesciences Ltd. | 173881 | 1263.25 | 0.70 |
| Finance | |||
| Bajaj Finserv Ltd. | 153000 | 2864.62 | 1.59 |
| Muthoot Finance Ltd. | 129000 | 2751.31 | 1.53 |
| Financial Technology (Fintech) | |||
| Pb Fintech Ltd. | 219000 | 3205.28 | 1.78 |
| Food Products | |||
| Nestle India Ltd. | 132000 | 2890.34 | 1.60 |
| Godrej Agrovet Ltd. | 292000 | 2088.24 | 1.16 |
| Gas | |||
| Mahanagar Gas Ltd. | 351000 | 4343.63 | 2.41 |
| Household Products | |||
| Doms Industries Ltd. | 165996 | 3994.78 | 2.22 |
| It - Services | |||
| Inventurus Knowledge Solutions Ltd. | 100418 | 1802.25 | 1.00 |
| It - Software | |||
| Tata Consultancy Services Ltd. | 243000 | 8464.30 | 4.69 |
| Sonata Software Ltd. | 819530 | 2958.50 | 1.64 |
| HCL Technologies Ltd. | 171000 | 2693.34 | 1.49 |
| Newgen Software Technologies Ltd. | 284276 | 2661.53 | 1.48 |
| Mastek Ltd. | 81000 | 1802.86 | 1.00 |
| Zensar Technologies Ltd. | 243000 | 1794.43 | 1.00 |
| Kpit Technologies Ltd. | 139147 | 1666.15 | 0.92 |
| Industrial Manufacturing | |||
| Jupiter Wagons Ltd. | 723000 | 2097.78 | 1.16 |
| Industrial Products | |||
| Kirloskar Pneumatic Company Ltd. | 275000 | 2748.49 | 1.52 |
| Polycab India Ltd. | 45500 | 2144.60 | 1.19 |
| Insurance | |||
| ICICI Prudential Life Insurance Company Ltd. | 569000 | 3138.60 | 1.74 |
| HDFC Life Insurance Co. Ltd. | 500000 | 3042.50 | 1.69 |
| ICICI Lombard General Insurance Co. Ltd. | 108000 | 1826.23 | 1.01 |
| Leisure Services | |||
| Praveg Ltd. | 33744 | 165.48 | 0.09 |
| Oil | |||
| Oil India Ltd. | 764663 | 2620.50 | 1.45 |
| Petroleum Products | |||
| Reliance Industries Ltd. | 486000 | 5832.49 | 3.23 |
| Realty | |||
| Sunteck Realty Ltd. | 551370 | 2015.26 | 1.12 |
| Retailing | |||
| Zomato Ltd. | 2718000 | 6036.68 | 3.35 |
| Trent Ltd. | 42300 | 2052.21 | 1.14 |
| Transport Infrastructure | |||
| Adani Ports And Special Economic Zone Ltd. | 279000 | 2983.63 | 1.65 |
| Repo | 321.23 | 0.18 | |
| Portfolio Total | 162393.36 | 90.05 | |
| Cash / Net Current Asset | 17930.29 | 9.95 | |
| Net Assets | 180323.65 | 100.00 | |
| Issuer Name | % to NAV |
| HDFC Bank Ltd. | 7.24 |
| Tata Consultancy Services Ltd. | 4.69 |
| ITC Ltd. | 4.06 |
| Zomato Ltd. | 3.35 |
| Reliance Industries Ltd. | 3.23 |
| Solar Industries India Ltd. | 3.09 |
| Bse Ltd. | 3.01 |
| Radico Khaitan Ltd. | 2.87 |
| Mahanagar Gas Ltd. | 2.41 |
| Doms Industries Ltd | 2.22 |
| Total | 36.17 |
| Large Cap | 45.97% |
| Mid Cap | 23.45% |
| Small Cap | 30.57% |
| Market Capitalisation is as per list provided by AMFI. | |


