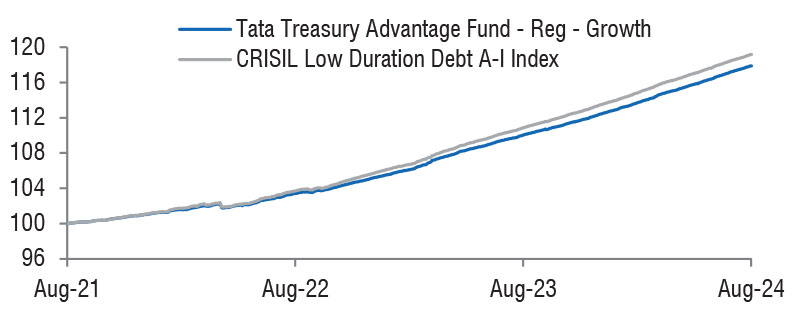
| Tata Treasury Advantage Fund
(An open ended low duration debt scheme investing in instruments such that the Macaulay duration of portfolio is between 6 months and 12 months. |

As on 28th February 2025


|
The Scheme will invest in various money market and fixed income securities with objective of providing liquidity and generating reasonable returns with lower interest rate risk. The average maturity of the portfolio shall be between three months to one year
INVESTMENT OBJECTIVE:The investment objective of the scheme is to generate regular income & capital appreciation by investing in a portfolio of debt & money market instruments with relatively lower interest rate risk. However, there is no assurance or guarantee that the investment objective of the Scheme will be achieved. The Scheme does not assure or guarantee any returns.
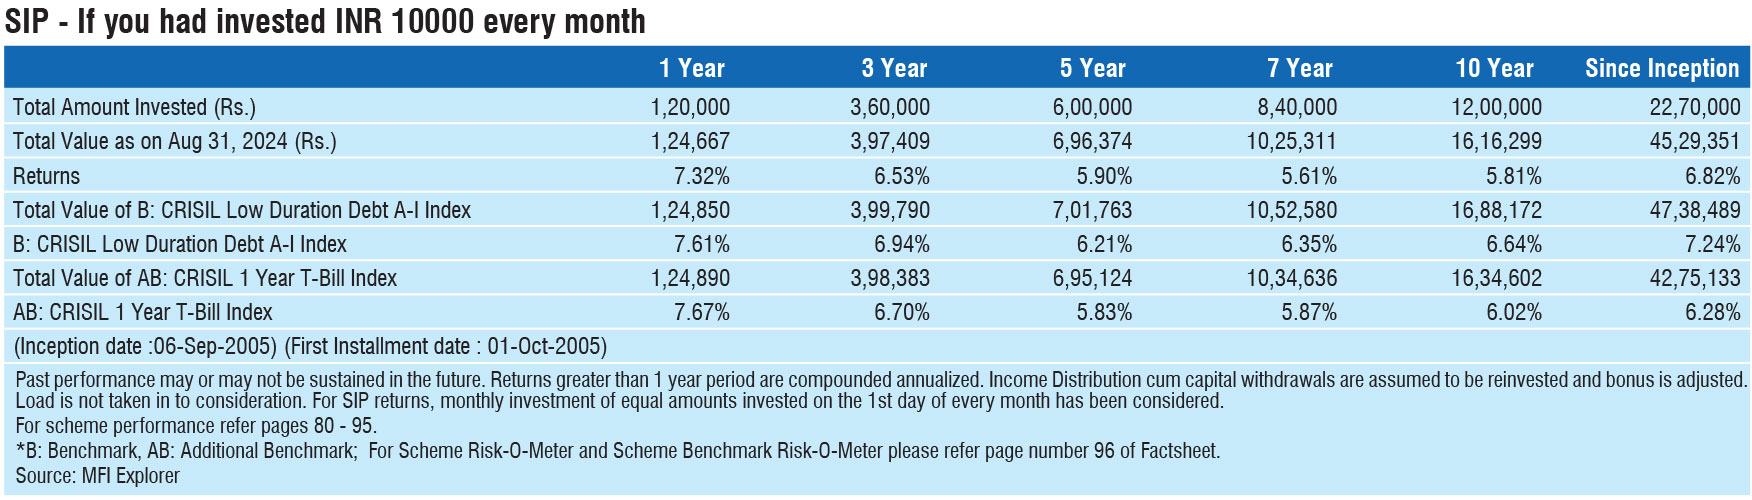
DATE OF ALLOTMENT:September 06,2005
FUND MANAGER(S)Akhil Mittal (Managing Since 26-Jun-14 and overall experience of 23 years) & Abhishek Sonthalia (Managing Since 06-Feb-20 and overall experience of 16 years)
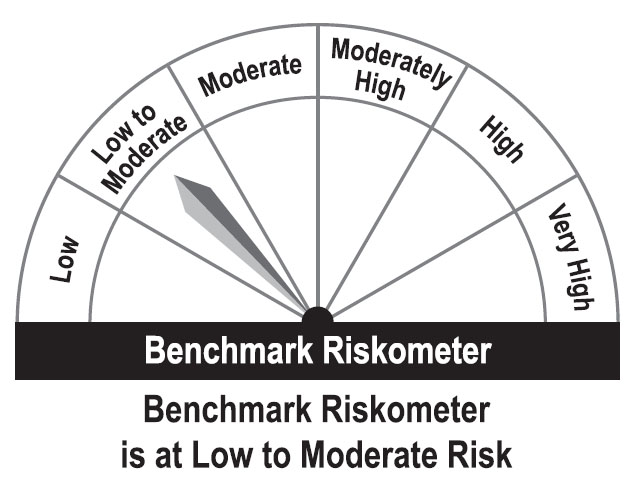
BENCHMARK:CRISIL Low Duration Debt A-I Index
NAV (in Rs.)| Direct - Growth | 3927.0230 |
| Direct - IDCW | 2490.4374 |
| Direct - Weekly Div | 1008.5567 |
| Direct - Daily IDCW | 1003.5316 |
| Reg - Growth | 3822.8864 |
| Reg - IDCW | 2423.2780 |
| Reg - Weekly Div | 1008.5289 |
| Reg - Daily IDCW | 1003.5288 |
| FUND SIZE | |
| Rs. 2366.45 (Rs. in Cr.) | |
| MONTHLY AVERAGE AUM | |
| Rs. 2363.97 (Rs. in Cr.) | |
| EXPENSE RATIO** | |
| Direct | 0.25 |
| Regular | 0.59 |
| **Note: The rates specified are actual month end expenses charged as on Feb 28, 2025. The above ratio includes the GST on Investment Management Fees. The above ratio excludes, borrowing cost, wherever applicable. | |
| VOLATILITY MEASURES^ | FUND | BENCHMARK |
| Std. Dev (Annualised) | 0.56 | 0.59 |
| Portfolio Beta | 0.91 | NA |
| R Squared | 0.96 | NA |
| Treynor | -0.02 | NA |
| Jenson | -0.03 | NA |
| Portfolio Macaulay Duration | : | 10.89 Months |
| Modified Duration | : | 10.33 Months |
| Average Maturity | : | 13.46 Months |
| Annualized Yield to Maturity (For Debt Component)* | ||
| - Including Net Current Assets | : | 7.42% |
| *Computed on the invested amount for debt portfolio | ||
| ^Risk-free rate based on the FBIL Overnight MIBOR rate of 6.4% as
on Feb 28, 2025 For calculation methodology | ||
MULTIPLES FOR NEW INVESTMENT:
Rs. 5,000/- and in multiples of Re. 1/- thereafter.
ADDITIONAL INVESTMENT/MULTIPLES FOR EXISTING INVESTORS:
Rs. 1,000/- and multiples of Re. 1/- thereafter.
LOAD STRUCTURE:| ENTRY LOAD | Not Applicable |
| EXIT LOAD |
NIL |
Please refer to our Tata Mutual Fund website for fundamental changes, wherever applicable
| Name of the Instrument | Ratings | Market Value Rs Lakhs | % to NAV |
| Debt Instruments | |||
| Government Securities | 28133.96 | 11.89 | |
| SDL Kerala 7.80% (15/03/2027) | SOV | 9670.02 | 4.09 |
| SDL Andhra Pradesh 6.55% (27/05/2028) | SOV | 4158.67 | 1.76 |
| SDL Andhra Pradesh 7.02% (26/02/2030) | SOV | 2499.34 | 1.06 |
| Sgs Karnataka 6.95% (25/09/2028) | SOV | 2444.13 | 1.03 |
| SDL Haryana 7.63% (01/06/2028) | SOV | 2043.24 | 0.86 |
| SDL Madhya Pradesh 8.42% (08/08/2028) | SOV | 1567.63 | 0.66 |
| SDL Karnataka 7.76% (13/12/2027) | SOV | 1533.92 | 0.65 |
| SDL Gujarat 8.50% (28/11/2028) | SOV | 1052.06 | 0.44 |
| SDL Gujarat 8.08% (26/12/2028) | SOV | 519.74 | 0.22 |
| SDL Gujarat 8.17% (19/12/2028) | SOV | 520.96 | 0.22 |
| SDL Gujarat 8.53% (20/11/2028) | SOV | 526.38 | 0.22 |
| SDL Karnataka 7.08% (14/12/2026) | SOV | 502.47 | 0.21 |
| SDL Karnataka 08.08% (26/12/2028) | SOV | 415.96 | 0.18 |
| SDL Tamilnadu 8.28% (21/02/2028) | SOV | 362.99 | 0.15 |
| SDL Karnataka 8.52% (28/11/2028) | SOV | 157.97 | 0.07 |
| SDL Tamilnadu 08.68% (10/10/2028) | SOV | 158.48 | 0.07 |
| Non-Convertible Debentures/Bonds/Zcb | 105250.62 | 44.49 | |
| 07.80 % Nabard | CRISIL AAA | 10039.10 | 4.24 |
| 07.43 % Small Indust Devlop Bank Of India | CRISIL AAA | 9965.78 | 4.21 |
| 08.20 % Power Finance Corporation | CRISIL AAA | 5500.72 | 2.32 |
| 07.77 % Rec Ltd. | CRISIL AAA | 5010.26 | 2.12 |
| 07.70 % Nabard | CRISIL AAA | 5010.21 | 2.12 |
| 07.50 % Nabard | CRISIL AAA | 4987.65 | 2.11 |
| 07.99 % Hdb Financial Services Ltd. (HDFC Ltd.) | CRISIL AAA | 4996.98 | 2.11 |
| 06.40 % John Deere Financial India Pvt Ltd. | CRISIL AAA | 4971.53 | 2.10 |
| 06.50 % Power Finance Corporation | CRISIL AAA | 4962.64 | 2.10 |
| 08.30 % Smfg India Credit Company Ltd. | CRISIL AAA | 4528.53 | 1.91 |
| 07.70 % Rec Ltd. | CRISIL AAA | 3500.80 | 1.48 |
| Tata Capital Ltd. - Zcb | CRISIL AAA | 3168.24 | 1.34 |
| 06.80 % Smfg India Credit Company Ltd. | CRISIL AAA | 2997.19 | 1.27 |
| 07.63 % Power Finance Corporation | CRISIL AAA | 2499.30 | 1.06 |
| 08.10 % ICICI Home Finance Co.Ltd. | CRISIL AAA | 2511.37 | 1.06 |
| 07.69 % LIC Housing Finance Ltd. | CRISIL AAA | 2497.61 | 1.06 |
| 07.97 % Tata Capital Housing Finance Ltd. | CRISIL AAA | 2499.34 | 1.06 |
| 08.19 % NTPC Ltd. | CRISIL AAA | 2508.53 | 1.06 |
| 08.04 % Hdb Financial Services Ltd. (HDFC Ltd.) | CRISIL AAA | 2499.84 | 1.06 |
| 05.99 % LIC Housing Finance Ltd. | CRISIL AAA | 2498.81 | 1.06 |
| 08.15 % Power Grid Corporation Of India Ltd. | CRISIL AAA | 2500.30 | 1.06 |
| 08.52 % LIC Housing Finance Ltd. | CRISIL AAA | 2500.11 | 1.06 |
| 07.49 % Nabard | CRISIL AAA | 2493.23 | 1.05 |
| 07.25 % Exim | CRISIL AAA | 2492.29 | 1.05 |
| 07.72 % Bajaj Finance Ltd. | CRISIL AAA | 2495.70 | 1.05 |
| 08.05 % NTPC Ltd. | CRISIL AAA | 2010.58 | 0.85 |
| 08.28 % Smfg India Credit Company Ltd. | CRISIL AAA | 1503.71 | 0.64 |
| 07.64 % Power Finance Corporation | CRISIL AAA | 999.84 | 0.42 |
| 07.80 % Bajaj Finance Ltd. | CRISIL AAA | 500.10 | 0.21 |
| 08.95 % Indian Railways Finance Corporation Ltd. | CRISIL AAA | 400.17 | 0.17 |
| 08.11 % Rec Ltd. | CRISIL AAA | 200.16 | 0.08 |
| Securitised Debt Privately Placed/ Unlisted | 5945.70 | 2.52 | |
| 08.12 % India Universal Trust Al1 | IND AAA(SO) | 2355.29 | 1.00 |
| 08.02 % India Universal Trust Al1 | IND AAA(SO) | 1888.50 | 0.80 |
| 08.03 % India Universal Trust Al2 | CRISIL AAA(SO) | 1701.91 | 0.72 |
| Money Market Instruments | 86831.46 | 36.71 | |
| Axis Bank Ltd. - CD | CRISIL A1+ | 9622.85 | 4.07 |
| HDFC Bank Ltd. - CD | CRISIL A1+ | 9602.43 | 4.06 |
| LIC Housing Finance Ltd. - CP | CRISIL A1+ | 7495.69 | 3.17 |
| Bank Of Baroda - CD | IND A1+ | 7487.18 | 3.16 |
| Punjab National Bank - CD | CRISIL A1+ | 7485.80 | 3.16 |
| HDFC Bank Ltd. - CD | CRISIL A1+ | 4989.55 | 2.11 |
| ICICI Securities Ltd. - CP | CRISIL A1+ | 4981.82 | 2.11 |
| Barclays Investments & Loans (India) Pvt Ltd. - CP | CRISIL A1+ | 4887.55 | 2.07 |
| Treasury Bill 182 Days (29/08/2025) | SOVRN SOV | 4842.48 | 2.05 |
| Canara Bank - CD | CRISIL A1+ | 4725.66 | 2.00 |
| Punjab National Bank - CD | CRISIL A1+ | 4719.91 | 1.99 |
| Small Indust Devlop Bank Of India - CD | CRISIL A1+ | 4647.78 | 1.96 |
| Indian Bank - CD | CRISIL A1+ | 2997.18 | 1.27 |
| Canara Bank - CD | CRISIL A1+ | 2491.00 | 1.05 |
| Axis Bank Ltd. - CD | CRISIL A1+ | 2450.86 | 1.04 |
| Standard Chartered Securites (India) Ltd. - CP | ICRA A1+ | 2404.48 | 1.02 |
| Axis Bank Ltd. - CD | CRISIL A1+ | 499.62 | 0.21 |
| Union Bank Of India - CD | ICRA A1+ | 499.62 | 0.21 |
| Aif Cat Ii | 741.09 | 0.31 | |
| Sbimf Aif - Cat I (Cdmdf)27/10/2038 | 741.09 | 0.31 | |
| Repo | 4495.87 | 1.90 | |
| Portfolio Total | 231398.70 | 97.82 | |
| Cash / Net Current Asset | 5246.07 | 2.18 | |
| Net Assets | 236644.77 | 100.00 | |