| Young Citizens’ Fund
(An open ended fund for investment for children having a lock-in for at least 5 years or till the child attains |
 |
As on 28th February 2025


|
An equity-oriented scheme that aims to create long term wealth through quality companies providing long term growth opportunities. The debt portion aims to generate regular income through quality debt securities.
INVESTMENT OBJECTIVE:The investment objective of the Scheme is to generate long term capital growth. However, there is no assurance or guarantee that the investment objective of the Scheme will be achieved. The scheme does not assure or guarantee any return.
DATE OF ALLOTMENT:October 14, 1995
FUND MANAGER(S)Amey Sathe (Managing Since 09-Mar-21 and overall experience of 17 years) ( (Managed in the past from 20-Apr-2020 to 08-Mar-2021 as Lead Fund Manager)
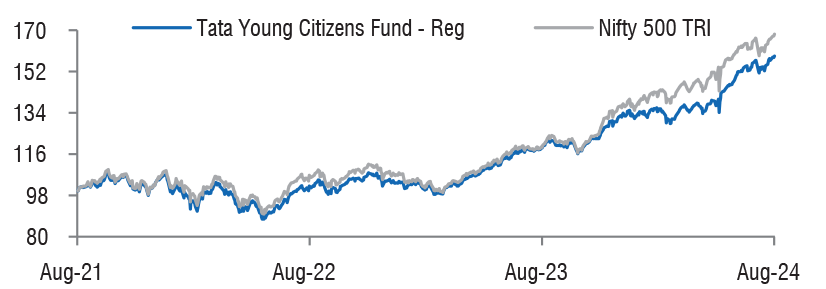
BENCHMARK:Nifty 500 TRI
NAV (in Rs.)| Direct | : 59.6610 |
| Reg | : 53.7394 |
| FUND SIZE | |
| Rs. 322.14 (Rs. in Cr.) | |
| MONTHLY AVERAGE AUM | |
| Rs. 338.39 (Rs. in Cr.) | |
| TURN OVER | |
| Portfolio Turnover (Equity component only) | 42.50% |
| EXPENSE RATIO** | |
| Direct | 1.90 |
| Regular | 2.57 |
| **Note: The rates specified are actual month end expenses charged as on Feb 28, 2025. The above ratio includes the GST on Investment Management Fees. The above ratio excludes, borrowing cost, wherever applicable. | |
| VOLATILITY MEASURES^ | FUND | BENCHMARK |
| Std. Dev (Annualised) | 13.72 | 14.47 |
| Sharpe Ratio | 0.39 | 0.46 |
| Portfolio Beta | 0.89 | NA |
| R Squared | 0.94 | NA |
| Treynor | 0.50 | NA |
| Jenson | -0.05 | NA |
| ^Risk-free rate based on the FBIL Overnight MIBOR rate of 6.4% as
on Feb 28, 2025 For calculation methodology | ||
MULTIPLES FOR NEW INVESTMENT:
Rs. 500/- and in multiples of Rs. 500/- thereafter.
ADDITIONAL INVESTMENT/MULTIPLES FOR EXISTING INVESTORS:
Rs. 500/- and in multiples of Rs. 500/- thereafter.
LOAD STRUCTURE:| ENTRY LOAD | Not Applicable |
| EXIT LOAD |
Compulsory Lock-in Option: 5 years or till
the child attains age of majority
(whichever is earlier). If redeemed before
child attains 18 years of age, Exit load is
1% (Effective from May 3, 2018) |
Please refer to our Tata Mutual Fund website for fundamental changes, wherever applicable
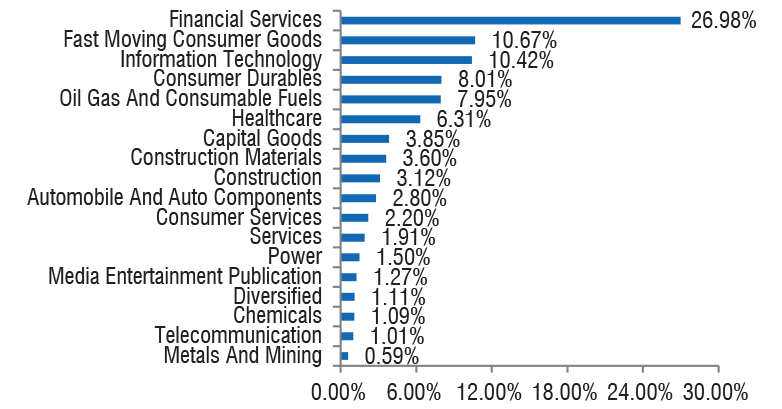
| Company name | Ratings | No. of Shares Rs Lakhs | % to NAV |
| Equity & Equity Related Total | 31930.31 | 99.11 | |
| Agricultural Food & Other Products | |||
| Marico Ltd. | 120000 | 720.72 | 2.24 |
| Tata Consumer Products Ltd. | 70000 | 674.59 | 2.09 |
| Auto Components | |||
| MRF Ltd. | 500 | 526.87 | 1.64 |
| Kross Ltd. | 177456 | 295.48 | 0.92 |
| Cie Automotive India Ltd. | 70000 | 263.24 | 0.82 |
| Banks | |||
| HDFC Bank Ltd. | 160000 | 2771.84 | 8.60 |
| ICICI Bank Ltd. | 125000 | 1505.13 | 4.67 |
| Kotak Mahindra Bank Ltd. | 60000 | 1141.77 | 3.54 |
| Axis Bank Ltd. | 82500 | 837.83 | 2.60 |
| City Union Bank Ltd. | 300000 | 443.40 | 1.38 |
| Indusind Bank Ltd. | 40000 | 396.04 | 1.23 |
| Dcb Bank Ltd. | 336000 | 350.28 | 1.09 |
| Beverages | |||
| United Spirits Ltd. | 51000 | 655.07 | 2.03 |
| Capital Markets | |||
| Uti Asset Management Company Ltd. | 50000 | 470.45 | 1.46 |
| Cement & Cement Products | |||
| Shree Cement Ltd. | 3000 | 818.52 | 2.54 |
| Commercial Services & Supplies | |||
| Teamlease Services Ltd. | 14000 | 272.86 | 0.85 |
| Construction | |||
| Larsen & Toubro Ltd. | 30000 | 949.16 | 2.95 |
| Pnc Infratech Ltd. | 120000 | 310.74 | 0.96 |
| Consumer Durables | |||
| Titan Company Ltd. | 26000 | 800.09 | 2.48 |
| Greenply Industries Ltd. | 200000 | 545.20 | 1.69 |
| Metro Brands Ltd. | 40000 | 446.86 | 1.39 |
| Indigo Paints Ltd. | 30000 | 305.96 | 0.95 |
| Vip Industries Ltd. | 75155 | 227.38 | 0.71 |
| Diversified | |||
| Godrej Industries Ltd. | 50000 | 548.80 | 1.70 |
| Diversified Fmcg | |||
| ITC Ltd. | 225000 | 888.75 | 2.76 |
| Hindustan Unilever Ltd. | 40000 | 876.10 | 2.72 |
| Electrical Equipment | |||
| Bharat Bijlee Ltd. | 9000 | 224.53 | 0.70 |
| Entertainment | |||
| Sun Tv Network Ltd. | 60000 | 336.90 | 1.05 |
| Fertilizers & Agrochemicals | |||
| Paradeep Phosphates Ltd. | 500000 | 434.45 | 1.35 |
| Sharda Cropchem Ltd. | 75000 | 371.66 | 1.15 |
| Finance | |||
| Aavas Financiers Ltd. | 40000 | 674.22 | 2.09 |
| Can Fin Homes Ltd. | 80000 | 462.12 | 1.43 |
| Repco Home Finance Ltd. | 97856 | 323.41 | 1.00 |
| Gas | |||
| Indraprastha Gas Ltd. | 280000 | 530.54 | 1.65 |
| Healthcare Services | |||
| Jupiter Life Line Hospitals Ltd. | 39560 | 567.96 | 1.76 |
| Metropolis Healthcare Ltd. | 23000 | 364.44 | 1.13 |
| It - Software | |||
| Infosys Ltd. | 80000 | 1350.16 | 4.19 |
| Tata Consultancy Services Ltd. | 28000 | 975.31 | 3.03 |
| Industrial Products | |||
| Bansal Wire Industries Ltd. | 97894 | 330.49 | 1.03 |
| Insurance | |||
| ICICI Lombard General Insurance Co. Ltd. | 40000 | 676.38 | 2.10 |
| HDFC Life Insurance Co. Ltd. | 100000 | 608.50 | 1.89 |
| Leisure Services | |||
| ITC Hotels Ltd. | 22500 | 36.86 | 0.11 |
| Minerals & Mining | |||
| Gravita India Ltd. | 35000 | 558.15 | 1.73 |
| Petroleum Products | |||
| Reliance Industries Ltd. | 130000 | 1560.13 | 4.84 |
| Castrol India Ltd. | 200000 | 425.26 | 1.32 |
| Pharmaceuticals & Biotechnology | |||
| Dr Reddys Laboratories Ltd. | 70000 | 781.55 | 2.43 |
| Akums Drugs And Pharmaceuticals Ltd. | 85000 | 387.18 | 1.20 |
| Power | |||
| Cesc Ltd. | 300000 | 392.37 | 1.22 |
| Realty | |||
| Brookfield India Real Estate Trust | 200000 | 598.34 | 1.86 |
| Retailing | |||
| Avenue Supermarts Ltd. | 11000 | 374.43 | 1.16 |
| Arvind Fashions Ltd. | 70000 | 266.53 | 0.83 |
| Telecom - Services | |||
| Indus Towers Ltd. | 85143 | 275.31 | 0.85 |
| Portfolio Total | 31930.31 | 99.11 | |
| Cash / Net Current Asset | 283.86 | 0.89 | |
| Net Assets | 32214.17 | 100.00 | |
| Issuer Name | % to NAV |
| HDFC Bank Ltd. | 8.60 |
| Reliance Industries Ltd. | 4.84 |
| ICICI Bank Ltd. | 4.67 |
| Infosys Ltd. | 4.19 |
| Kotak Mahindra Bank | 3.54 |
| Tata Consultancy Services Ltd. | 3.03 |
| Larsen & Toubro Ltd. | 2.95 |
| ITC Ltd. | 2.76 |
| Hindustan Unilever Ltd. | 2.72 |
| Axis Bank Ltd. | 2.60 |
| Total | 39.90 |
| Large Cap | 54.34% |
| Mid Cap | 15.01% |
| Small Cap | 30.65% |
| Market Capitalisation is as per list provided by AMFI. | |


